Non-communicable diseases (NCDs) remain among the leading causes of morbidity and mortality globally and are increasing rapidly in low- and middle-income countries, including South Africa.1 In South Africa, the growing burden of obesity, diabetes, cardiovascular diseases, hypertension, and other diet-related NCDs poses a major public health challenge and places substantial pressure on the healthcare system and broader economy.2,3 Dietary transitions characterised by increased consumption of energy-dense and nutrient-poor foods have contributed significantly to these trends.
A growing body of evidence identifies ultra-processed foods (UPFs) as a major contributor to unhealthy diets and obesity. According to the NOVA food classification system, UPFs are industrial formulations made mostly or entirely from substances extracted from foods, derived from food constituents, or synthesised in laboratories, with little or no intact whole foods present.4 These products typically contain ingredients not commonly used in domestic cooking, including flavour enhancers, colourants, emulsifiers, artificial sweeteners, preservatives, and other cosmetic additives designed to improve palatability, shelf life, and marketability. Examples include sugar-sweetened beverages, confectionery, packaged snacks, fast foods, processed meats, sweetened breakfast cereals, and some ready-to-eat meals. UPFs are generally high in free sugars, sodium, saturated fats, and energy density, while being low in dietary fibre and micronutrients.
Evidence consistently links UPF consumption with obesity, type 2 diabetes, cardiovascular disease, cancer, and other adverse health outcomes.5–7 In South Africa, the changing food environment, urbanisation, and aggressive commercial marketing of unhealthy foods and beverages have contributed to increased exposure to UPFs across all age groups.8,9 Food marketing has therefore emerged as an important commercial determinant of health.
The commercial determinants of health framework provides an important lens through which to understand the role of unhealthy food marketing in shaping dietary behaviours and population health outcomes. To increase revenue, food and beverage corporations use extensive advertising and promotional strategies to increase consumption of ultra-processed products, particularly in low- and middle-income countries undergoing rapid nutrition transitions.10 Understanding trends in UPF advertising expenditure is therefore important for examining how commercial practices influence unhealthy food environments in South Africa.
Advertising and marketing strategies employed by the food and beverage industry significantly influence consumer preferences, purchasing decisions, and dietary behaviours. Studies have shown that exposure to unhealthy food advertising shapes food preferences among children and adolescents and increases consumption of energy-dense nutrient-poor foods.11–13 Television advertising remains particularly influential because of its wide audience reach and repeated exposure. Children are especially vulnerable to persuasive marketing techniques and often lack the cognitive capacity to recognise the persuasive intent of advertising.14,15 Consequently, repeated exposure to unhealthy food advertisements can influence long-term dietary habits and brand loyalty.
Globally, food and beverage companies invest millions of dollars annually in advertising unhealthy food products across television, radio, print, outdoor, and digital media platforms. Research from Australia and Canada has shown that television accounts for the largest share of unhealthy food advertising expenditure and exposure.16,17 In South Africa, previous studies examining sugar-sweetened beverage advertising have demonstrated substantial advertising expenditures, particularly on television advertisements promoting carbonated drinks and energy drinks.18,19 These studies also found high levels of exposure during periods designated for child and family viewing.
The increasing commercial promotion of unhealthy foods and beverages in South Africa has occurred alongside policy efforts aimed at addressing obesity and diet-related NCDs. One of the most notable interventions was the implementation of the Health Promotion Levy (HPL) in 2018, which introduced a tax on sugar-sweetened beverages. Evidence suggests that the HPL contributed to reductions in purchases and consumption of taxed beverages.20,21 However, food and beverage companies continue to employ extensive marketing and advertising strategies that may undermine public health interventions and sustain consumption of unhealthy products.
Concerns have also been raised regarding the effectiveness of voluntary industry self-regulation in reducing children’s exposure to unhealthy food advertising. Although the Consumer Goods Council of South Africa introduced voluntary pledges to limit marketing of unhealthy products to children, studies suggest that exposure to unhealthy food and beverage advertising remains widespread.22,23 Furthermore, current regulatory frameworks have struggled to keep pace with the rapidly evolving advertising environment, particularly across digital and multimedia platforms.
Despite increasing recognition of the role of commercial determinants in shaping dietary behaviours, there remains limited longitudinal evidence on trends in UPF advertising expenditure and exposure in South Africa across media platforms and broadcasting periods. Existing studies have primarily focused on sugar-sweetened beverages and shorter analytical periods. There is therefore a need for comprehensive analyses examining broader categories of UPFs and changes in advertising patterns over time.
This study aimed to analyse trends in advertising expenditure and exposure to ultra-processed food advertisements in South Africa between 2013 and 2022. Specifically, the study examined advertising expenditure across media types, food categories, manufacturers, and broadcasting times using Nielsen advertising monitoring data. The study also assessed temporal patterns in broadcasting exposure across different periods of the day. By documenting these trends, the study contributes to understanding this aspect of the commercial determinants of unhealthy diets and provides evidence to inform food marketing regulation and public health policy in South Africa.
METHODS
This study employed a quantitative descriptive study design to examine trends in advertising expenditure and potential exposure to ultra-processed food advertisements in South Africa from January 2013 to December 2022, adjusted for inflation. The analysis focused on patterns in advertising expenditure across media platforms, food categories, manufacturers, and broadcasting periods. Expenditure is recorded in South African Rands (ZAR), where ZAR 17=US$1. All expenditures were deflated to constant 2025 South African Rands (ZAR) utilising the official Consumer Price Index published by Statistics South Africa. Nielsen Ad Intel data offers near-complete coverage of traditional media (TV, Radio, Print, Billboards). However, its digital metrics primarily capture display banners and static web placements, substantially underrepresenting programmatic social media marketing, influencer campaigns, and in-app advertisements.
Data source
Secondary advertising data were obtained from Nielsen’s advertising monitoring database.24 Nielsen systematically captures advertising information across multiple media platforms in South Africa, including television, radio, print media, and other advertising outlets. The database contains detailed information on advertisement occurrences, estimated advertising expenditure, broadcasting times, manufacturers, media platforms, and product categories.
The analysis focused on food and beverage products classified as ultra-processed according to the NOVA food classification system.4 The NOVA classification categorises foods according to the nature, extent, and purpose of industrial processing. Ultra-processed foods are defined as industrial formulations made predominantly from substances extracted or derived from foods and additives, with little or no intact whole food content.4 Classification was independently undertaken using published NOVA guidelines. Where product classification was uncertain, the research team reviewed product ingredients, manufacturer descriptions and product websites to reach consensus. Ambiguous products that could not be confidently classified were discussed among investigators until agreement was achieved.
Products classified as UPFs in this study included beverage and non-beverage categories identified within the Nielsen database, including carbonated beverages, fruit juices, energy and sports drinks, confectionery products, chocolates, sweetened breakfast cereals, biscuits, sweeteners, ice cream products, mayonnaise & salad dressing, pizza and other ready-to-eat beverages. Sugar-sweetened beverages (SSBs) were analysed as a key subgroup of UPFs because are strongly associated with obesity and diet-related NCDs.
Measures
Advertising expenditure
Advertising expenditure was aggregated by year, media type, food category, manufacturer, and broadcasting time. Media platforms were grouped into four broad categories: television, radio, print media, and other media. The “other media” category included outdoor advertising, internet-based advertising, and miscellaneous advertising platforms captured in the Nielsen database.
Manufacturers were ranked according to cumulative advertising expenditure during the study period. Food categories were grouped according to similarities in product type and processing characteristics.
Broadcasting time and potential exposure analysis
Broadcasting times recorded in 24-hour notation were analysed to assess temporal patterns in potential exposure to UPF advertisements. Advertisement occurrences were regrouped into hourly and broader daypart categories to facilitate analysis of broadcasting exposure throughout the day.
Daypart categories were defined as follows:
-
Early morning: 00:00 to 05:59;
-
Morning: 06:00 to 11:59;
-
Afternoon: 12:00 to 16:59;
-
Evening: 17:00 to 20:59; and
-
Night: 21:00 to 23:59
Advertisement frequencies were aggregated across these time periods to estimate potential exposure patterns and identify periods with higher concentrations of UPF advertising.
Data management and statistical analysis
Data cleaning, management, and statistical analyses were conducted using Stata version 18 and Microsoft Excel. Broadcasting time variables were converted into Stata time variables and regrouped into hourly and daypart categories using the hour component of the recorded broadcasting times.
Descriptive analyses were performed to summarise trends in advertising expenditure and advertisement frequencies over the study period. Expenditure trends were analysed across media types, food categories, manufacturers, and broadcasting periods. Annual and monthly aggregates were generated to examine temporal changes in advertising expenditure and potential exposure patterns.
Frequencies, percentages, means, totals, and graphical trend analyses were used to describe advertising patterns over time. Tables and figures were produced to illustrate expenditure trends across media platforms, manufacturers, food categories, and broadcasting periods.
RESULTS
Advertising expenditure by beverage categories
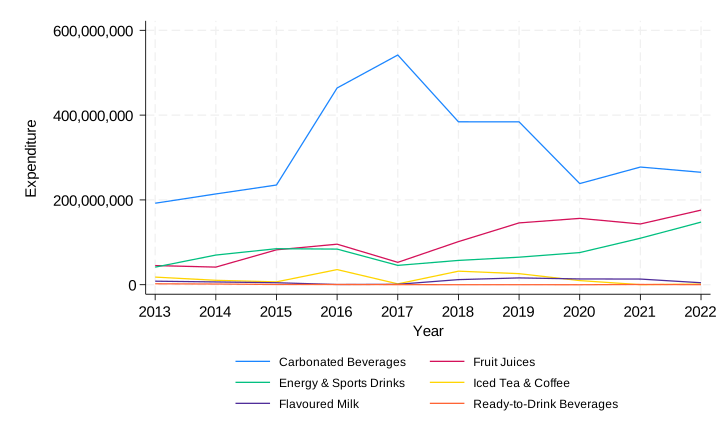
Between 2013 and 2022, total advertising expenditure for SSB-related UPFs amounted to approximately ZAR 5.25 billion. Carbonated beverages accounted for the largest share of expenditure at 60.9% (ZAR 3.20 billion), followed by fruit juices at 19.8% (ZAR 1.04 billion) and energy and sports drinks at 14.9% (ZAR 781.6 million), as shown in Table 1. Together, these three beverage categories accounted for approximately 95.6% of all beverage advertising expenditure during the study period. In contrast, iced tea and coffee products, flavoured milk, and ready-to-drink beverages contributed relatively small proportions of total expenditure.
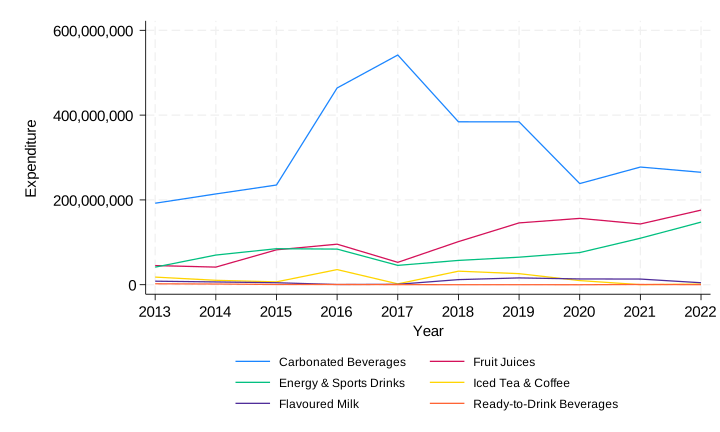
Across the ten-year study period, carbonated beverages remained the dominant category in terms of annual advertising expenditure, consistently accounting for substantially higher expenditures than all other beverage categories (Figure 1). Expenditure on energy and sports drinks and fruit juices also remained substantial over time, although at markedly lower levels compared with carbonated beverages. The findings further suggest sustained investment by beverage manufacturers in promoting sugary and highly processed beverage products throughout the study period.
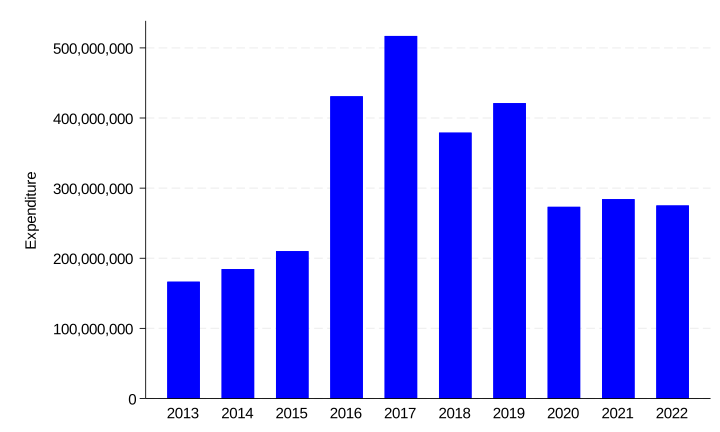
Prior to the HPL implementation (2013–2017), the mean annual advertising expenditure for carbonated beverages was ZAR 345 million. Following the levy (2018–2022), despite an immediate, transient drop in 2018, the mean annual expenditure rebounded to ZAR 294 million, demonstrating a sustained industry investment in product promotion despite fiscal constraints.
Advertising expenditure by food categories
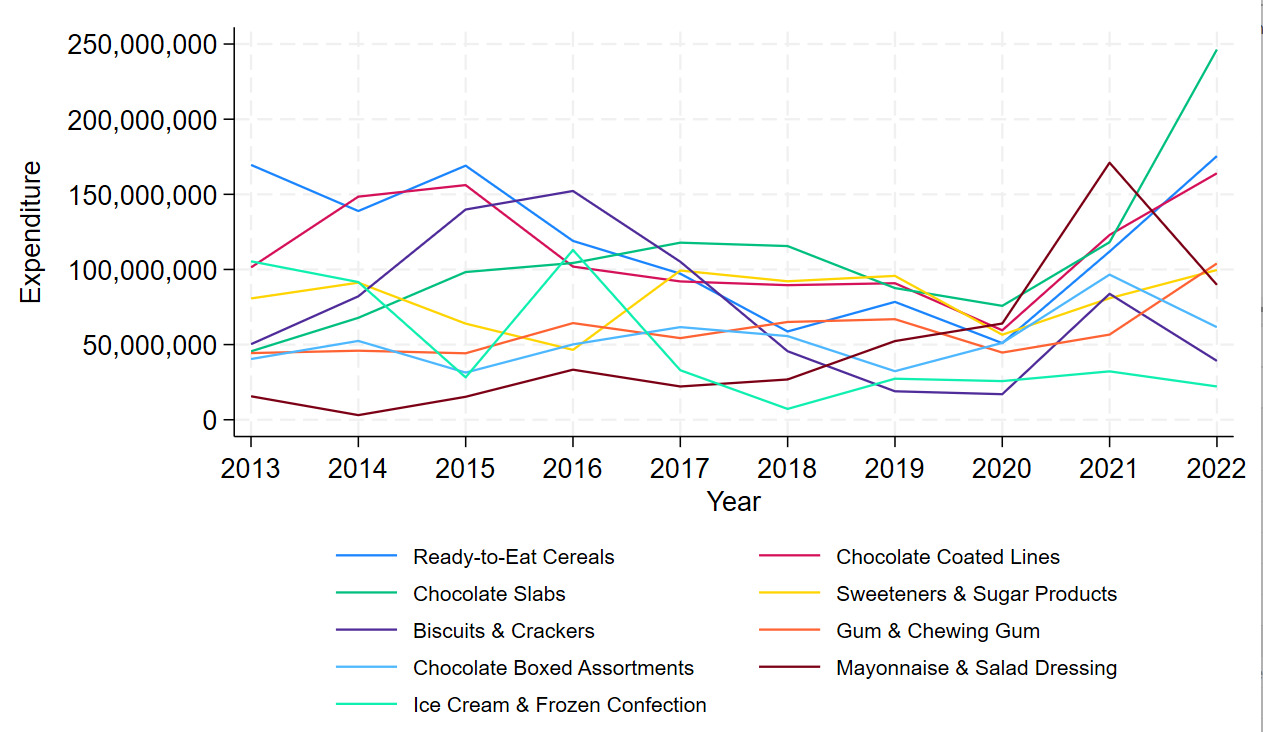
Total advertising expenditure for non-beverage UPFs exceeded ZAR 8.07 billion during the study period. Ready-to-eat cereals accounted for the highest share of expenditure at 14.5% (ZAR 1.17 billion), followed by chocolate coated lines (or chocolate-coated foods) at 14.0% (ZAR 1.13 billion) and chocolate slabs at 13.3% (ZAR 1.08 billion), as depicted in Table 2. Sweeteners and sugar products accounted for approximately 10.0% of total expenditure, while biscuits and crackers contributed 9.1%.
Other notable contributors included gum and chewing gum (7.3%), chocolate boxed assortments (6.6%), mayonnaise and salad dressing (6.1%), and ice cream and frozen confectionery products (6.0%). Together, the top ten food categories accounted for more than 90% of all food advertising expenditure between 2013 and 2022.
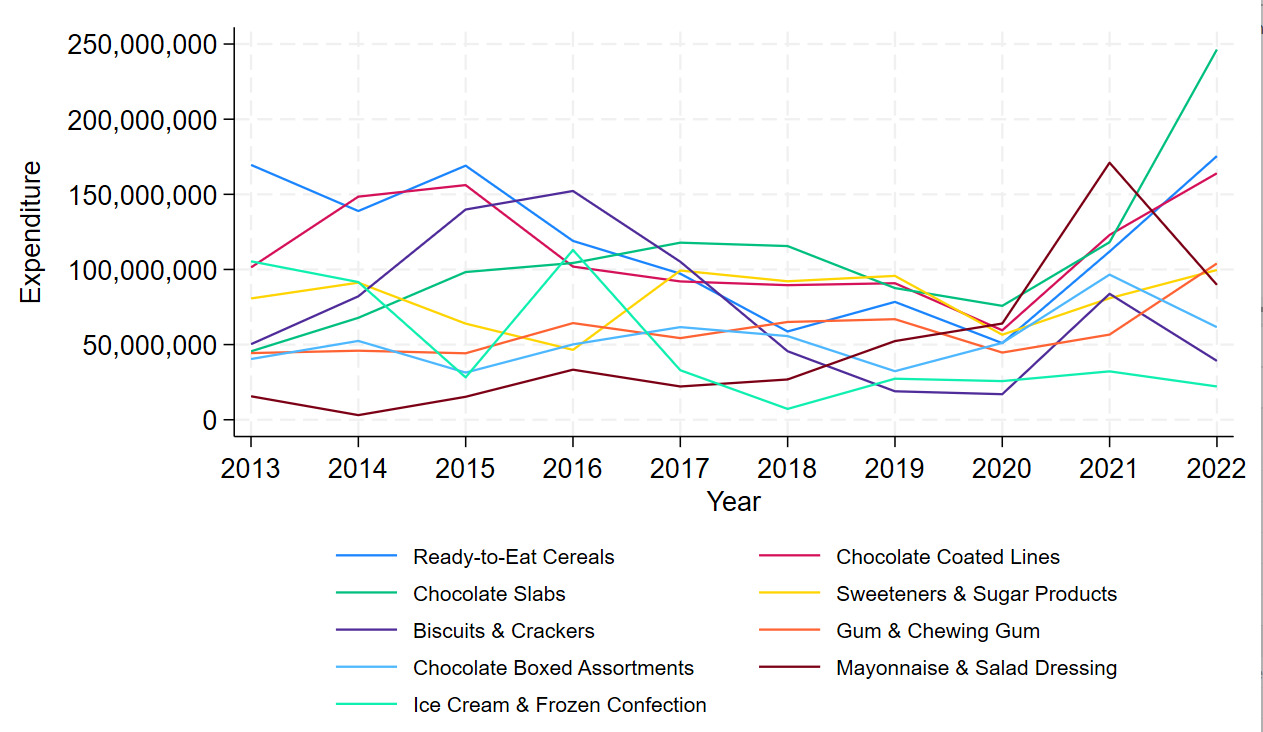
Annual trend analyses showed consistently high expenditures for ready-to-eat cereals and chocolate-related products across the study period. This sustained expenditure highlights the continued commercial importance of highly processed snack foods and convenience products within the South African food advertising environment.
Major advertisers
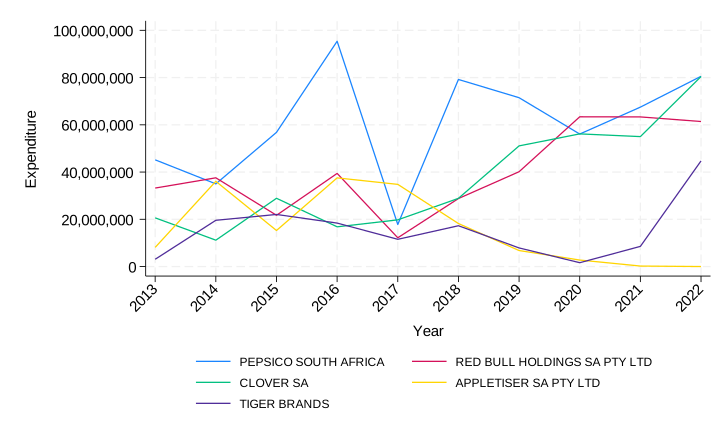
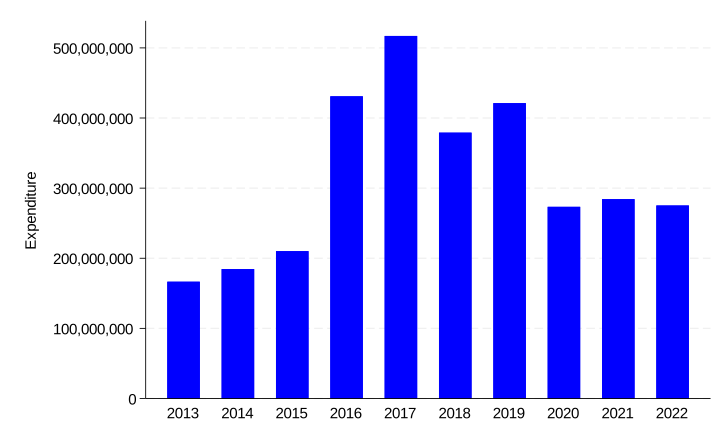
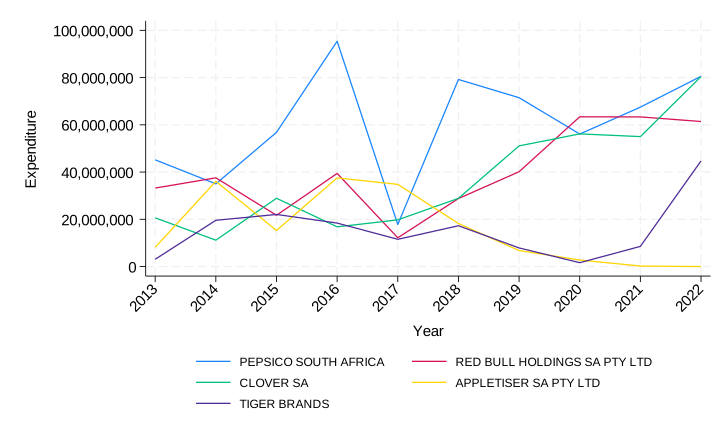
Advertising expenditure was highly concentrated among a small number of manufacturers. Table 3 presents the top 20 SSB manufacturers ranked according to share of total advertising expenditure between 2013 and 2022. Among these manufacturers, Coca-Cola South Africa emerged as the dominant advertiser, accounting for 61.5% of all SSB advertising expenditure during the study period, with total expenditure exceeding ZAR 3.14 billion. PepsiCo South Africa represented the second-largest advertiser at 11.8%, followed by Red Bull Holdings South Africa at 7.9% and Clover South Africa at 7.2%.
Appletiser South Africa and Tiger Brands each contributed approximately 3% of total SSB advertising expenditure. Collectively, the six largest advertisers accounted for approximately 94% of all SSB advertising expenditure between 2013 and 2022, demonstrating substantial market concentration within the beverage advertising sector.
Temporal analysis further demonstrated that Coca-Cola South Africa consistently recorded markedly higher annual advertising expenditure than all other manufacturers throughout the study period. Owing to the exceptionally large expenditure values associated with Coca-Cola South Africa, the company’s annual advertising trends were plotted separately to improve graphical clarity and facilitate clearer visual interpretation of expenditure patterns among the remaining manufacturers. Including Coca-Cola South Africa within the same figure as all other manufacturers would have substantially compressed the graphical scale and obscured variation among the remaining advertisers.
Advertising expenditure by media type
Table 4 presents combined advertising expenditure for both beverage and food-related ultra-processed products across media platforms between 2013 and 2022. Overall, television emerged as the dominant advertising medium across both product groupings. Among beverage products, television accounted for 69.2% of total advertising expenditure (ZAR 3.54 billion), followed by other media platforms at 16.5%, radio at 12.0%, and print media at 2.3%.
Similarly, television accounted for 92.2% of all food-related advertising expenditure (ZAR 7.17 billion). Radio contributed 3.2% of expenditure, while other media and print media accounted for 2.5% and 2.1%, respectively. The “other media” category included digital platforms, out-of-home advertising, cinema advertising, and direct mail advertising.
Collectively, the findings demonstrate the continued dominance of television advertising within the South African UPF advertising landscape during the study period, despite the growing expansion of digital and alternative media platforms. The substantially higher allocation of advertising expenditure towards television suggests that manufacturers continue to regard television as the most effective medium for achieving broad population reach and repeated potential consumer exposure.
Advertising expenditure by broadcasting time
Advertising expenditure varied substantially across broadcasting periods. For beverage advertisements, the evening period (17:00 to 20:59) accounted for the largest proportion of expenditure at 43.3% (ZAR 1.87 billion), followed by the afternoon period at 19.2%, morning at 18.9%, and night at 16.8%. Early morning advertising contributed only 1.8% of expenditure.
A similar pattern was observed for food advertisements. Evening broadcasting accounted for nearly half of all food advertising expenditure at 47.6% (ZAR 3.67 billion). Night-time broadcasting contributed 20.1% of expenditure, while afternoon and morning periods accounted for 17.0% and 14.9%, respectively. Early morning advertising represented less than 1% of total food advertising expenditure.
Overall, the concentration of UPF advertising expenditure during evening broadcasting periods suggests strategic placement of advertisements during peak audience viewing hours, including periods when children and families are more likely to be exposed to television programming. This pattern potentially increases repeated exposure to unhealthy food and beverage marketing among vulnerable population groups.
DISCUSSION
This study examined trends in advertising expenditure and potential exposure to ultra-processed food advertisements in South Africa between 2013 and 2022 using Nielsen advertising monitoring data. The findings demonstrate substantial investment in the advertising of ultra-processed food and beverage products across multiple media platforms, with particularly high expenditure concentrated in carbonated beverages, confectionery products, ready-to-eat cereals, and other highly processed snack foods. Television emerged as the dominant advertising medium, while evening broadcasting periods accounted for the highest levels of advertising expenditure and potential audience exposure.
The findings reinforce growing international evidence that food and beverage industries continue to invest heavily in the promotion of unhealthy products despite increasing concerns regarding obesity and diet-related NCDs. Previous studies conducted in Australia, Canada, and the United Kingdom similarly reported that unhealthy food advertising is concentrated in highly processed products rich in sugar, salt, and saturated fat.16,17,25 The dominance of carbonated beverages within advertising expenditure observed in this study is particularly concerning given the strong association between sugar-sweetened beverage consumption and obesity, type 2 diabetes, cardiovascular disease, dental caries, and other adverse health outcomes.5,26,27
Carbonated beverages accounted for more than 60% of all beverage advertising expenditure during the study period, substantially exceeding expenditure for all other beverage categories combined. This finding is consistent with earlier South African studies that identified carbonated soft drinks as the most heavily marketed beverage products.18,19 The sustained dominance of carbonated beverage advertising, even following implementation of the Health Promotion Levy in 2018, suggests that manufacturers continue using aggressive marketing strategies to maintain product demand despite fiscal interventions designed to reduce consumption. International evidence indicates that food and beverage companies frequently intensify marketing efforts in response to regulatory interventions, including taxation and product labelling requirements.28,29
The substantial expenditure on energy and sports drink advertising observed in this study is also noteworthy. Consumption of energy drinks has increased globally, particularly among adolescents and young adults, despite concerns regarding high caffeine and sugar content.30 Aggressive marketing strategies for energy drinks often target younger populations through youth-oriented branding, sports sponsorships, and entertainment marketing.31 In South Africa, increasing exposure to these products contribute to unhealthy consumption behaviours among young people.
Among food products, ready-to-eat cereals, confectionery products, sweeteners, biscuits, and chocolate products accounted for the largest share of advertising expenditure. Although some breakfast cereals are marketed as healthy or nutritious products, many commercially available ready-to-eat cereals contain high levels of added sugars and are classified as ultra-processed foods according to the NOVA classification system.32 The heavy promotion of confectionery and snack products aligns with global evidence showing that foods high in sugar, salt, and fat dominate food marketing environments.33,34
Television remained the dominant advertising platform throughout the study period, accounting for approximately 69% of beverage advertising expenditure and more than 92% of food advertising expenditure. This finding is consistent with previous South African and international studies reporting that television remains one of the most influential channels for unhealthy food marketing because of its extensive audience reach and audiovisual persuasive capacity.15–17 Television advertising is particularly influential among children because repeated exposure shapes food preferences, purchase requests, and consumption habits.9,11,12
Although television remained the dominant advertising platform during the study period, food and beverage marketing environments are increasingly expanding into digital and social media platforms. This highlights the evolving nature of unhealthy food marketing exposure and the need for future research examining digital advertising practices targeting children and adolescents in South Africa.35
The dominance of evening broadcasting periods in UPF advertising expenditure is especially important from a public health perspective. While our data show that nearly half of all UPF advertising expenditure is concentrated during evening slots (17:00–20:59), we cannot verify child viewership rates directly. However, this heavy concentration in prime-time slots indicates that industry placement strategies maximise potential exposure to general audiences, which structurally includes children during peak family viewing hours.36,37 This structural pattern highlights a loophole in current voluntary self-regulatory frameworks, which predominantly restrict placement only within narrow child-specific programming blocks.
Evidence demonstrates that children are particularly vulnerable to persuasive food marketing because they often lack the cognitive maturity to critically interpret advertising intent.38 Exposure to unhealthy food advertisements has been associated with increased food preferences for advertised products, higher caloric intake, increased snack consumption, and greater purchase requests directed at parents.39,40 Repeated advertising exposure during childhood may also contribute to the development of long-term brand recognition and unhealthy dietary habits that persist into adulthood.41
The findings therefore raise concerns regarding the adequacy of current voluntary self-regulatory approaches intended to protect children from unhealthy food marketing exposure in South Africa. Although industry pledges may restrict advertising specifically directed at children’s programming, many advertisements continue to appear during family viewing periods where substantial child audiences are present. Similar concerns have been documented internationally, where voluntary advertising restrictions have often failed to meaningfully reduce children’s exposure to unhealthy food marketing.35
The findings also reveal substantial concentration of advertising expenditure among a small number of multinational manufacturers, particularly Coca-Cola South Africa and PepsiCo South Africa. Similar market concentration patterns have been documented internationally, where a few multinational corporations dominate unhealthy food and beverage advertising markets.42 This concentration highlights the significant influence of transnational food corporations in shaping food environments and dietary behaviours within low- and middle-income countries.10 The commercial power of these corporations may undermine public health interventions aimed at reducing unhealthy food consumption.
These findings reinforce international evidence supporting comprehensive statutory regulation of unhealthy food marketing. WHO recommends restricting the marketing of unhealthy foods and non-alcoholic beverages to children across all media, while countries such as Chile, Mexico and the United Kingdom have demonstrated the feasibility of implementing comprehensive regulatory approaches.35,40,41 Emerging evidence suggests that these interventions may reduce exposure to unhealthy food marketing and improve dietary behaviours.
Although television accounted for most advertising expenditure during the study period, food marketing is increasingly shifting towards digital platforms, including social media, influencer marketing and algorithm-driven advertising. Future surveillance systems should therefore incorporate digital media to provide a more comprehensive assessment of children’s exposure to unhealthy food marketing in South Africa.
Strengths and limitations
This study has several strengths. First, it utilised a large national advertising monitoring database spanning a ten-year period, allowing for comprehensive longitudinal analysis of advertising expenditure trends across multiple media platforms. Second, the study examined both food and beverage categories and included analyses by manufacturer, media type, and broadcasting period, thereby providing a broad assessment of the unhealthy food advertising environment in South Africa. Third, the use of Nielsen advertising monitoring data provided objective measures of advertising expenditure and potential broadcasting exposure across diverse media channels.
However, several limitations should be acknowledged. The study relied on secondary advertising expenditure data rather than direct measures of advertisement exposure, audience reach or dietary outcomes. Product classification was based on food categories rather than nutrient composition of individual products. In addition, because the Nielsen database primarily captures conventional advertising platforms, exposure through digital and social media—including influencer marketing, sponsored content, advergaming and algorithm-driven advertising—was not comprehensively captured and may therefore be underestimated. Future studies should integrate digital marketing surveillance with traditional advertising monitoring to better characterise the evolving food marketing environment. Furthermore, this study relies on a longitudinal descriptive design rather than quasi-experimental econometric modelling, such as an interrupted time-series (ITS) analysis or segmented regression. Although a ten-year dataset provides a robust baseline, an ITS model was conceptually unfeasible for the entire database; the 2018 Health Promotion Levy (HPL) exclusively targeted sugar-sweetened beverages, leaving other major UPF categories without a distinct policy ‘shock’ to anchor a temporal model. Additionally, isolating a clean post-2018 policy effect is heavily confounded by the systemic market disruptions of the COVID-19 pandemic (2020–2021). Without individual-level consumer data or time-varying economic controls to isolate these macro-shocks, a segmented regression across the broader food sector would introduce a high risk of residual confounding. Future research evaluating specific sub-sectors should explore quasi-experimental frameworks if appropriate market controls can be secured
Policy implications
The findings support the need for stronger statutory regulation of unhealthy food marketing in South Africa. Given the concentration of advertising expenditure in ultra-processed foods and beverages and the predominance of television advertising during peak viewing periods, voluntary self-regulation appears insufficient to protect children and adolescents from unhealthy food promotion.
South Africa should consider adopting comprehensive mandatory regulations aligned with WHO recommendations. These could include restrictions on advertising HFSS foods during periods of high child viewership, the use of nutrient profiling to define products subject to regulation, restrictions on child-directed marketing techniques across all media, stronger monitoring and enforcement mechanisms, and regulation of digital marketing. Complementary measures such as front-of-package warning labels and school marketing restrictions may further strengthen the food policy environment.
CONCLUSION
This study provides the first comprehensive longitudinal assessment of ultra-processed food and beverage advertising expenditure in South Africa over a ten-year period. Advertising expenditure remained concentrated among a small number of multinational manufacturers and was dominated by television advertising, particularly during peak viewing periods. These findings suggest continued population exposure to unhealthy food marketing despite increasing concerns regarding obesity and diet-related NCDs. Strengthening statutory regulations of unhealthy food marketing, including television and emerging digital platforms, should be considered an important component of South Africa’s broader NCD prevention strategy.
Ethics statement
Patients and/or the public were not involved in the design, or conduct, or reporting, or dissemination plans of this research. A waiver of ethical clearance was approved by the Human Research Ethics Committee at the University of Witwatersrand (HRECNMW25/07/07).
Data availability
The data that support the findings of this study are available from Nielsen Ad Intel. Restrictions apply to the availability of these data, which were used under license for this study. Interested parties can contact ukbrasupport@nielsen.com to inquire about accessing this proprietary data.
Funding
This study received funding from Bloomberg Philanthropies through the University of North Carolina, USA (grant number 5106249) and the UK National Institute of Health and Care Research (NIHR) (grant number 156820), with additional support from the South African Medical Research Council (grant number 23108). The views expressed in this publication are those of the authors and not necessarily those of the funders or affiliated institutions. The funders had no role in the study design, analysis or the decision to publish.
Authorship contributions
CD, ET, MKB and SG conceptualised the study. CD conducted the data analysis. CD, MKB and SG contributed to the drafting and revision of the manuscript.
Disclosure of interest
The authors completed the ICMJE Disclosure of Interest Form (available upon request from the corresponding author) and disclose no relevant interests.
Correspondence to:
Name Surname: Chengetai Dare
Institution: SAMRC/Wits Centre for Health Economics and Decision Science – PRICELESS SA (A Division of Wits Health Consortium), School of Public Health, Faculty of Health Sciences, University of the Witwatersrand
Address: 27 St Andrews Road, Parktown, Johannesburg 2193
Email: chengetai.dare@wits.ac.za
Country: South Africa