The supply of health products constitutes a strategic and cross-cutting function of health system supply chains, the performance of which simultaneously determines care continuity, the quality of clinical services, and the economic efficiency of health facilities.1,2 In low- and middle-income countries (LMICs), chronic supply chain failures, such as stock-outs, product expiry, prolonged delays, and management inefficiencies, remain major structural barriers to equitable access to essential medicines.3,4 A global survey of medicine prices and availability across 54 low- and middle-income countries found that the average availability of generic medicines ranged from 37.8% to 68.3% in the public sector and from 42.3% to 77.4% in the private sector across WHO regions. Medicine prices were consistently high, with patients required to pay 3.0 to 11.5 times international reference prices for lowest-priced generic medicines, representing a significant affordability burden for the poorest households and illustrating the systemic economic cost of supply chain underperformance.5 These dysfunctions have direct repercussions on health outcomes, user confidence, and the overall performance of health systems.6
The economic viability of supply systems rests on the capacity of health facilities to mobilise, allocate, and sustainably manage their human, material, and financial resources, while applying logistics processes that conform to recognised standards.7,8 Reference conceptual frameworks, notably the ‘six rights’ approach — right product, right quality, right quantity, right place, right condition, and right cost — emphasise that this performance is not limited to product availability, but depends closely on the quality of planning, rigorous stock management, control of logistics costs, and the robustness of financial monitoring mechanisms.9,10 The economic theory of supply chains further stresses the necessity of integrated cost-effectiveness analysis, taking into account transaction, storage, product obsolescence, and opportunity costs.8,11
In sub-Saharan Africa, despite structural reforms and the gradual introduction of logistics information systems, the economic viability of public supply systems remains fragile: insufficient qualified personnel, inadequate storage infrastructure, irregular financing, and weak financial accountability mechanisms persist.12–14 In Benin, significant institutional efforts have been made through the operationalisation of zonal distribution depots, the adoption of the electronic logistics management information system (e-LMIS), and the strengthening of supervision mechanisms.15 Nevertheless, recent empirical data enabling a multidimensional assessment of the actual economic viability of these systems at the operational level remain scarce and insufficiently grounded in health economics analytical frameworks.
It is within this context that the present study was conducted, aiming to analyse the economic viability of health product supply in public facilities of the Allada-Toffo-Zè (ATZ) health district in Benin in 2025. Drawing on the Donabedian model, it consisted of a joint assessment of structural components and logistics processes, as well as the measurement of four original composite economic indicators.
METHODS
Study Setting
The study was conducted in the Allada-Toffo-Zè (ATZ) health district, an operational unit of the Beninese health system located in the Atlantique department in southern Benin. This district covers three communes — Allada, Toffo, and Zè — and comprises 34 public health facilities, including one district hospital, one zonal distribution depot (ZDD), and 32 health centres. The ZDD manages health products procured preferentially from SoBAPS. It is responsible for receiving, storing, and distributing products to health facilities according to a PULL model, with a defined periodicity based on expressed needs. The ATZ district was chosen based on (i) the completeness of its three-level pharmaceutical supply chain; (ii) the effective operationalisation of the e-LMIS; and (iii) the availability of data required for a multidimensional evaluation.
Study Design and Sampling
This was a cross-sectional evaluative study, conducted from March to July 2025. Simple random sampling without replacement was applied to the list of 32 health centres to select 15 peripheral facilities. The district hospital and the zonal distribution depot were systematically included, resulting in a final sample size of 17 health facilities (50% of the district). The selection of respondent agents within each facility was purposive, targeting individuals directly involved in the logistics and financial management of health products.
Variables, Indicators, and Data Collection Tools
The primary variable, the economic viability of supply, was operationalised according to two complementary analytical dimensions based on the Donabedian model:
-
Structure component: human, material, and financial resources; information system (e-LMIS); and informational resources.
-
Process component: selection/quantification; ordering/receiving; storage; distribution; service functioning; and financial and economic management.
-
Outcome component: adherence to the six criteria of economic performance (the ‘six rights’): right product, right quality, right quantity, right place, right condition, right cost.9
Four original composite economic indicators were constructed from the collected data to enhance analytical robustness and move beyond binary (good/poor) assessments. These were the Composite Logistics Efficiency Index (CLEI), the Six Rights Compliance Index (SRCI), the Economic Vulnerability Index (EVI), and the Storage Failure Opportunity Cost (SFOC). Their calculation, based on sub-component scores and methodological standards, along with their definitions, are presented in Table 1.
Economic viability, as operationalised in this study, refers to minimum normative functionality, i.e., the capacity to meet core supply chain standards across structure, process, and outcomes simultaneously. This is distinct from long-term economic sustainability or allocative efficiency, which are captured only partially by the composite indicators (CLEI, EVI, SFOC) and require longitudinal data for full assessment.16
Data collection was performed using triangulation: a standardised observation grid, a documentary review of logistics and financial records, and semi-structured interviews with managers.
Data Analysis
Components were assessed as a percentage (score obtained / expected score). Evaluation was conducted according to the scale adapted from Varkevisser et al. (2003)18: Good (≥80%); Insufficient (<80%). A facility was considered economically viable if it achieved a “Good” rating in all three components simultaneously. The 80% performance threshold is consistent with internationally recognised standards for health system assessment, including the WHO health system performance monitoring framework, which uses this threshold to distinguish adequate from inadequate functional performance.19 Reference values for the composite indicators (CLEI, SRCI) were aligned with operational standards from USAID/DELIVER9 and WHO Good Storage Practices.10 Quantitative data were analysed using Microsoft Excel 2016; composite indicators and figures were generated. Qualitative data were subjected to thematic content analysis.
Data quality was ensured through cross-verification of scores against logistics records and financial documents. Qualitative interview findings were used to contextualise borderline quantitative scores (i.e., within ±5% of the 80% threshold) and to confirm or challenge observed practices, in line with convergent triangulation design.20
Ethics
The protocol was approved by the Scientific and Ethics Committee of the Institut Régional de Santé Publique (IRSP) in Cotonou. Required administrative authorisations were obtained from the Ministry of Health and the ATZ Health District. Participation was voluntary, based on free and informed consent. Anonymity and confidentiality of participants were strictly guaranteed.
RESULTS
‘Structure’ Component
According to Table 4, 16 out of 17 facilities (94.12%) reached the 80% threshold. Only the Djanglammè Health Centre achieved a score of 78.26% (insufficient).
The 17 surveyed facilities each had at least two qualified staff members assigned to health product management (Table 2). All 36 staff members (100%) had received at least one supervision visit during the period. All managers had a job description. However, an organisational chart was displayed in only 9 of the 16 health centres (56.25%), and only 3 out of 17 facilities (17.65%) possessed their own means of transport. The e-LMIS software was operational in all facilities, but none had a displayed financial dashboard (0/17). Three facilities had debts to the zonal distribution depot (17.65%).
‘Process’ Component
All 17 facilities (100%) reached the 80% threshold for the process component (Table 4). Among the sub-components of the ‘Process’ component, selection/quantification, service functioning, and financial and economic management were mastered, with observation scores of 100% for almost all facilities (Table 3). Significant disparities persist in the critical operational links of storage (scores ranging from 53.85% to 100%) and distribution, where the Soyo Health Centre is notable for a drop to 37.50%, accumulating the sole deficiency in ordering/receiving (90.91%) and confirming its status as the weak link in the supply chain.
Forecasting was universally performed using the consumption-based method via the e-LMIS. Purchase orders were submitted on time by 100% of health centres and systematically archived. Recourse to emergency orders concerned only two facilities (11.76%). The ‘first expired, first out’ (FEFO) principle was applied in all facilities, and a monthly inventory was conducted everywhere. However, 7 facilities (41.18%) presented risks related to the presence of pests and 4 (23.53%) to humidity. Display of selling prices was effective in 1 out of 16 health centres (6.25%). Pharmaceutical revenue was fully reinvested in future supply in all facilities (100%).
‘Outcome’ Component — Economic Viability
All 17 facilities (100%) reached the 80% threshold for the economic outcome component, with a score of 88.89% for health centres and 100% for the zonal distribution depot. These results attest to the overall adherence to the six criteria of economic performance throughout the entire supply chain of the ATZ health district (Table 4).
Composite Economic Indicators
Composite Logistics Efficiency Index (CLEI)
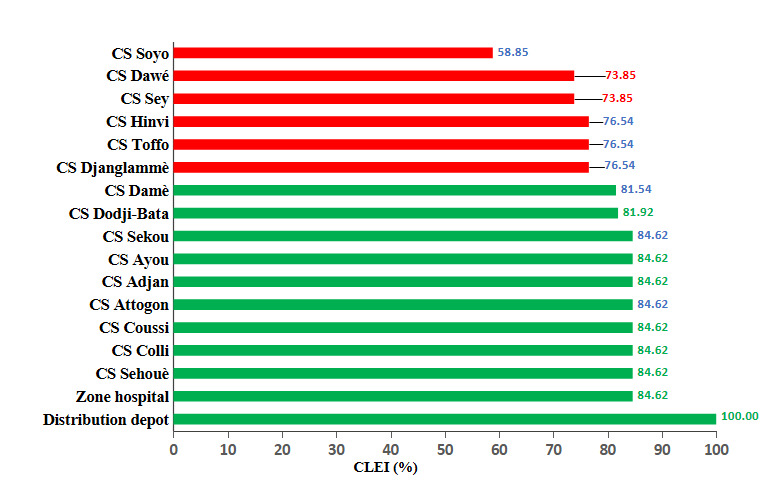
According to Figure 1, six out of 17 facilities (35.3%) presented a CLEI below the efficiency threshold of 80%, including the Soyo Health Centre (58.85%), a case of cumulative underperformance in storage (53.85%) and distribution (37.50%).
Analysis of the CLEI in the ATZ health district for 2025 reveals universal mastery of the selection/quantification sub-component (100% for all facilities), and significant disparities in the downstream links of the supply chain, where storage scores ranged from 53.9% to 100% and distribution scores from 37.5% to 100%. This resulted in a mean CLEI of 80.66%, with eight facilities classified as “good” (including the district hospital at 84.62%, close to the reference standard of the zonal distribution depot at 100%), while six others were deemed “insufficient”, primarily due to critical weaknesses in storage conditions (notably Sey HC, Soyo HC, and Dawé HC with 53.9%) and severe distribution failures for Soyo HC (37.5%), which recorded the lowest score in the district (58.85%).
_by_health_facility_in_the_atz_health_district_.png)
Six Rights Compliance Index (SRCI)
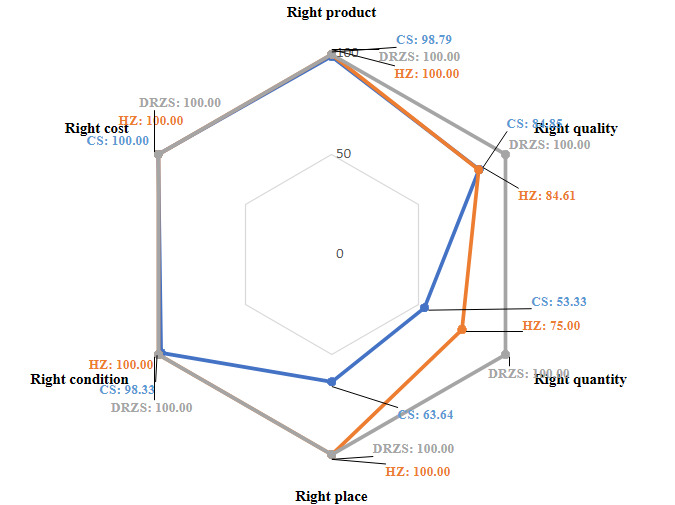
The Six Rights Compliance Index (SRCI) for 2025 was 86.51%, driven by the unanimous excellence of facilities on the criteria of “right product”, “right quantity”, and “right cost” (100%) (Figure 2), while the district hospital achieved a score of 90.71%, very close to the reference standard of the zonal distribution depot which attained perfection (100%). According to Table 4, two facilities were underperforming (Djanglammè HC at 78.85% and Soyo HC at 72.69%), as they struggled to guarantee the “right quality” and “right condition” of services, with Soyo HC facing compounded critical deficiencies in “right place” (37.5%) and “right quantity” (90.9%).
_by_facility_level_in_the_atz_health_district__2025.png)
Economic Vulnerability Index (EVI)
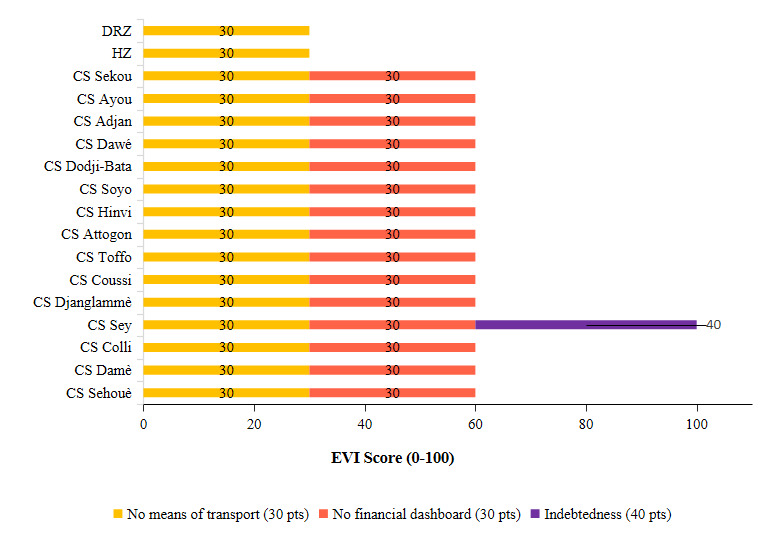
According to Figure 3, fifteen out of 17 facilities presented a “Moderate” risk, with a score of 60 points, due to the universal absence of a financial dashboard and the lack of dedicated means of transport. Only the district hospital and the zonal distribution depot exhibited a “Low” risk (30 pts), attributable to their transport allocation, while the Sey Health Centre stood out as the sole facility at “Very High” risk (100 pts), combining the two aforementioned deficiencies with indebtedness, placing it in a particularly critical situation.
_of_health_facilities_in_the_atz_health_district__2025.png)
Storage Failure Opportunity Cost (SFOC)
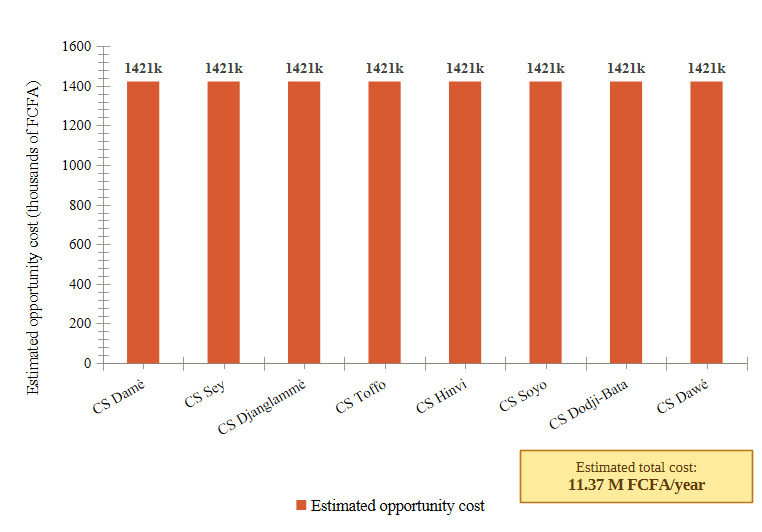
The annual Storage Failure Opportunity Cost (SFOC) was estimated at FCFA 1,421,356 per at-risk facility (applying the WHO rate of 5% to the median cash holding value of FCFA 28,427,124), amounting to a total of FCFA 11,370,850 per year for the 8 facilities presenting storage deficiencies (humidity or pests) (Figure 4).

Overall Assessment of Economic Viability
The synthesis of the three components and the composite indicators led to 16 out of 17 facilities (94.12%) being classified as economically viable (Table 4). The Djanglammè Health Centre constituted the sole case of demonstrated structural fragility. The Soyo Health Centre, although viable according to normative criteria, exhibited the most fragile economic performance in the sample (CLEI=58.85%; SRCI=72.69%).
DISCUSSION
‘Structure’ Component: Robust Organisation, Targeted Vulnerabilities
The structural performance rate of 94.12% significantly exceeds regional benchmarks. Lesego et al. (2024) in Zimbabwe documented 94% coverage of health facilities by the national supply chain management system and an increase in order fill rates from 42% to 91% over the intervention period14; Seidman & Atun (2017) documented deficits in the adoption of logistics information systems in LMICs21; Lugada et al. (2022) noted that only 33.6% of supply chain positions were filled in Uganda.13 The universal qualification and supervision of the 36 staff members (100%) confirm the positive effect of human resource strengthening policies implemented in Benin.15 The complete adoption of the e-LMIS (100%) contrasts with the low adoption rate of the e-LMIS in Uganda, where only 6% of health facilities exclusively used the Electronic Medical Logistics Information System,13 as well as with the digital infrastructure deficiencies in Zimbabwe,14 and with findings from studies in French-speaking West Africa showing that incomplete adoption of logistics information systems remains a persistent barrier to rational supply planning.4,21 However, two structural vulnerabilities warrant attention: only 17.65% (3/17) of facilities possessed their own means of transport, compared to a recommended target of 80%9; and no facility had a financial dashboard, a gap that neither the e-LMIS nor ongoing training has yet filled.2
‘Process’ Component: Overall Normative Compliance, Residual Fragilities
The process compliance rate and the low recourse to emergency orders (11.76% vs. 30% of Ugandan health facilities13) attest to robust logistical discipline. The full reinvestment of revenue (100%), higher than African benchmarks where pharmaceutical cost recovery deficits are frequently reported,3 consolidates the revolving fund mechanism stemming from the Bamako Initiative.22 Storage remains the most economically fragile link: 41.18% of facilities presented risks related to pests and 23.53% to humidity, consistent with storage condition deficits reported in sub-Saharan Africa.10,13 WHO Good Storage Practices (2010) require 100% compliance, a standard met by only 58.82% of facilities. The near-absence of price display (6.25%) compromises pricing transparency, a major determinant of user trust and a regulatory mechanism against overcharging.3,6
‘Outcome’ Component and Composite Indicators
Achievement of the 80% threshold by all facilities for economic viability exceeds regional benchmarks: 84% of Ugandan facilities reporting stock-outs,13 order fill rates below 50% from 2018 to 2020 in Zimbabwe,14 and 55-75% in West Africa.21 The composite indicators nuance this favourable picture: the CLEI reveals 6 insufficient facilities (35.3%), including the Soyo Health Centre (58.85%), highlighting latent underperformance invisible in normative assessments. The SRCI confirms the ‘right condition’ and ‘right quality’ (storage) criteria as systemic Achilles’ heels. The EVI exposes a universal moderate vulnerability (82.35%) not perceptible in classic evaluations. The SFOC of FCFA 11.37 million/year provides a decisive budgetary argument for preventive investments with immediate returns.3,11 Consistent with the observations of Yadav (2015),8 these cross-sectional results should be interpreted as a point-in-time snapshot, potentially subject to social desirability bias.
Overall Viability and Implications for Health Policy
The viability of the ATZ district (94.12%) is better than that observed in the sub-region (45-72%).21 These comparisons must be interpreted with caution: the referenced studies21 measured pharmaceutical availability and procurement cost savings using heterogeneous methodologies, and do not apply the composite economic viability framework used in this study. The figures serve as contextual benchmarks rather than direct comparisons. The reforms implemented in Benin, such as the establishment of zonal distribution depots, the adoption of the e-LMIS, supervision, and self-financing, appear to be producing tangible effects, consistent with the recommendations of Wirtz et al. (2017)3 and Nartey (2024).7 Nevertheless, the universal absence of a financial dashboard and the inadequacy of the transport fleet limit long-term sustainability.2,8 The Djanglammè Health Centre illustrates the syndrome of fragile, multi-deficit facilities,8 i.e., the accumulation of multidimensional deficits resistant to sectoral interventions.
Implications for the Deployment of National Guidelines
The results of this study have implications for the implementation of the national guidelines for the supply of health products down to the last mile, which the country has recently adopted.15 Among the interventions they suggest are: (i) integrating an automated “financial dashboard” module into the e-LMIS2,21; (ii) including a budget line in the plans derived from the 2026-2030 National Health Development Plan for upgrading storage conditions, primarily in the 8 at-risk facilities in the ATZ district (as the cost-benefit ratio is positive from the first year: investment 500-800 kFCFA vs. SFOC 1,421 kFCFA/facility); (iii) progressively providing facilities with means of transport.9
Limitations
Four limitations of this study should be noted. (i) The cross-sectional design does not allow for establishing causal relationships or assessing the temporal dynamics of performance.8 (ii) The study is limited to 17 facilities in a single health district, which precludes statistical generalisation to other districts or countries. However, as a purposively selected case with full three-tier supply chain coverage and complete e-LMIS operationalisation, the ATZ district offers conditions of analytical transferability: the composite indicators and evaluative framework developed here are applicable to comparable settings, consistent with the logic of case-based transferability in health systems research.23 (iii) The weights of the composite indicators (CLEI, EVI) were defined a priori without local empirical validation. A formal sensitivity analysis under alternative weighting schemes was not conducted; however, the convergence of results across independent indicators (e.g., facilities underperforming on the CLEI also scored lowest on the SRCI and EVI) provides indirect evidence of robustness. Formal sensitivity testing remains a priority for future work. (iv) A social desirability bias inherent in direct observations cannot be excluded.18
CONCLUSIONS
This study demonstrates that the Allada-Toffo-Zè health district presents an overall satisfactory economic viability of its health product supply system in 2025, with 94.12% of public facilities viable according to normative criteria. The universal adoption of the e-LMIS, the documented procedural discipline, and the sustainability of the cost recovery mechanism constitute significant institutional achievements that compare favourably with findings from sub-Saharan Africa, though structural vulnerabilities identified by the composite indicators call for continued investment.
However, the four composite economic indicators constructed in this study reveal underlying heterogeneity and cross-cutting structural vulnerabilities — such as the universal absence of a financial dashboard, inadequacy of transport means, and storage failures with a quantified economic cost — that conventional normative evaluations do not capture. The estimated annual opportunity cost of FCFA 11.37 million for storage failures alone illustrates the concrete economic dimension of these vulnerabilities and their importance as budgetary arguments for decision-makers.
These results argue for an evolution in the strategy for strengthening health product supply systems in Benin, integrating local economic management tools, preventive investments with documented returns, and multidimensional approaches for facilities in situations of cumulative fragility. Longitudinal studies and an extension of this methodology to other health districts would help consolidate the evidence base necessary for sustainably viable pharmaceutical policies.
Acknowledgements
The authors are grateful to IRSP-CAQ, the Ministry of Health, and the coordination teams and health-zone staff of the Allada-Toffo-Zè health zone for their valuable support and collaboration.
Disclaimer
The views expressed in this article are those of the authors and do not necessarily represent the official position of their institutions.
Ethics statement
This study was approved by the Ethics Board of the Regional Institute of Public Health (IRSP). Informed consent was obtained from all participants prior to data collection. Confidentiality and anonymity were strictly maintained throughout the study.
Data availability
The datasets generated and analysed during the current study are available from the corresponding author upon reasonable request.
Funding
The research presented in this manuscript received no external funding.
Authorship contributions
All authors meet the ICMJE authorship criteria, contributed significantly to the work, and approved the final version of the manuscript.
Disclosure of interest
The authors completed the ICMJE Disclosure of Interest Form (available upon request from the corresponding author) and disclose no relevant interests.
Correspondence to:
Lamidhi Salami
Institut Régional de Santé Publique, Université d’Abomey-Calavi
Cotonou, Benin
s.lamidhi@yahoo.com