By 2050, an estimated 4.758 billion people, or close to half of the world’s population, are projected to be myopic.1 The most influential country-level economic assessment to date is a cost-of-illness study of urban China, which surveyed 23 819 people aged 5-50 years in three provinces and found that the total economic burden of myopia was 173.6 billion Chinese yuan (USD 26.3 billion), of which lost productivity (USD 16.1 billion) exceeded the cost of treatment and prevention (USD 10.1 billion).2 Complementary global modelling estimated that vision impairment from uncorrected myopia caused USD 244 billion in lost productivity in 2015, and that East Asia bore a burden equal to 1.27% of gross domestic product (GDP), among the highest of any world region.3 A separate global analysis estimated annual productivity losses from moderate and severe vision impairment and blindness at USD 410.7 billion in purchasing-power-parity terms, and found that the relative reduction in employment among working-age people with vision loss was 30.2%.4
It is important to distinguish myopia, a refractive error, from visual impairment, a functional consequence. Most people with myopia achieve normal corrected visual function with spectacles, contact lenses or refractive surgery and experience no disability. Myopia is nevertheless a risk factor for pathologic complications, including myopic maculopathy, that may cause irreversible vision loss, particularly in high myopia.5 Productivity effects in the present model are intended to capture two distinct pathways: first, small but population-wide effects arising from periods of uncorrection or under-correction, accommodative strain and digital eye-strain symptoms; and second, larger but individually rare effects of visual impairment arising from pathologic complications.
Japan is a salient setting. In the Nagahama Study, a population-based cohort of 9850 adults aged 34-80 years in western Japan, age-standardised and sex-standardised prevalences of myopia and high myopia were 49.97% and 7.89% respectively.6 The working-age population is projected to contract substantially by mid-century. A prevalence-based analysis estimated the total economic cost of all-cause visual impairment in Japan at approximately 1.7% of GDP,7 but no myopia-specific estimate exists. We address this gap with an exploratory model that pairs a deterministic base case with a Monte Carlo probabilistic sensitivity analysis (PSA).
METHODS
Study design
We performed an exploratory prevalence-based cost-of-illness analysis from a societal perspective, estimating the annual myopia-attributable economic burden in Japan in Japanese yen (JPY) at 2024-2025 price levels. USD equivalents are given throughout at an exchange rate of 150 JPY per USD, approximating the 2024-2025 average. The study is reported in accordance with the Consolidated Health Economic Evaluation Reporting Standards 2022 (CHEERS 2022)8; the completed checklist is provided in the Online Supplementary Document. Because the analysis used only aggregate, publicly available data and involved no individual participant data, institutional review board approval and informed consent were not required.
The framework follows a three-component cost-of-illness structure: productivity loss from mild-to-moderate effects of myopia, productivity loss from severe visual impairment and blindness, and direct treatment and correction cost. An informal caregiving component was added to reflect reduced labour-market participation among family carers of people with vision loss. We note that a prevalence-based framework captures the current annual burden but does not model incidence dynamics, lifetime costs, or the long-term consequences of childhood progression. An incidence-based or lifetime model would be the appropriate next step once Japanese progression and treatment-uptake data become available, and would better support cost-effectiveness analysis of preventive interventions, which the present study does not perform.
Data sources and parameters
Epidemiological and economic inputs were drawn from public sources (Table 1). The prevalence anchor is the Nagahama Study, the most rigorous Japanese source available, but it is a single-region cohort restricted to ages 34-80 years; applying its standardised prevalence to the whole labour force, which includes adults aged 15-33 years, is an extrapolation, and regional, generational and socioeconomic variation is not captured. Where no Japanese value was available, notably for the mild-to-moderate productivity decrement and the severe visual impairment fraction among people with high myopia, we adopted international parameters or explicit modelling assumptions and varied them across plausible ranges in the PSA.
Justification of individual parameters
Four parameters required judgement and are set out here in full. First, the mild-to-moderate productivity decrement of 2% has no Japanese empirical anchor. We selected it as a deliberately conservative value at the low end of decrements reported in the wider presenteeism literature for common, adequately managed chronic conditions, on the reasoning that most people with myopia are corrected and that any population-average decrement must therefore be small. We emphasise that this is an assumption, not a measurement, and it is varied widely in the probabilistic analysis. Second, the severe visual impairment fraction among people with high myopia of 1.5% is a modelling assumption informed by the myopic maculopathy grading literature5; published complication rates vary substantially with lesion definition and follow-up duration, so a single defensible point value does not exist. Third, the employment-reduction rate of 30.2% is taken directly from a global estimate for working-age people with moderate or severe vision impairment or blindness.4 Fourth, the caregiving multiplier of 0.8 has no empirical anchor in either the Japanese or the international literature and is a structural convention adopted to avoid omitting carer opportunity cost entirely.
Selection of probability distributions
Distributions were selected on the basis of the natural support and shape of each quantity rather than by fitting to data, since for several parameters no data exist to fit. Proportions and bounded rates were assigned Beta distributions because they are constrained to the interval from zero to one; concentration parameters were chosen so that the resulting 95% intervals matched the plausible ranges in Table 1, with a tighter concentration for myopia prevalence, which is measured in a large cohort, than for the decrement, which is not measured at all. Average salary was assigned a Normal distribution because it is a precisely measured national statistic with approximately symmetric sampling error. Blended care spend was assigned a Gamma distribution because expenditure is strictly non-negative and right-skewed, a small minority of people incurring much higher costs than the median. The caregiving multiplier was assigned a Triangular distribution, the conventional choice when only a plausible minimum, mode and maximum can be stated and no distributional information is available. Parameters were resampled independently; we did not impose correlations between them, which is itself a simplifying assumption discussed below.
Structural assumptions
The model rests on four structural assumptions that are not tested by the sensitivity analysis and that constrain interpretation. First, the four cost components are assumed additive and mutually exclusive, so that no loss is counted twice and none is omitted. Second, productivity loss is assumed proportional to earnings, so that the human capital approach values a lost hour at the average wage; a friction cost approach would give materially lower estimates. Third, the myopic working population is treated as homogeneous, with a single average decrement applied across all severities, occupations and correction modalities. Fourth, parameters are assumed independent, whereas in reality prevalence, correction adequacy and care spend are plausibly correlated. Each assumption tends to simplify rather than to inflate or deflate the estimate in a predictable direction, with the exception of the human capital approach, which is likely to place the estimate at the upper end of what a friction cost method would yield.
Calculation
Mild-to-moderate productivity loss was estimated as the product of myopic workers, average salary and the productivity decrement. Myopic workers were derived as labour force multiplied by prevalence, giving 34.7 million. Severe productivity loss was estimated as the product of high-myopic workers, the severe visual impairment fraction, the employment-reduction rate and average salary. Direct cost applied a blended annual per-person spend across the myopic population, reflecting the population mix of correction modalities: most people use spectacles only, a minority use disposable contact lenses, and a small fraction receive active management with atropine or myopia-control contact lenses. Informal caregiving was scaled as a proportion of severe productivity loss. Components were summed to a societal total.
Double counting and component independence
Each component captures a distinct loss: productivity decrement during normal working time; productivity loss from withdrawal from work due to severe visual impairment; out-of-pocket and system spending on correction, examinations and treatment; and carer opportunity cost. Productivity loss arising from health care use, such as time spent at routine ophthalmology visits, is small at population scale, typically one visit per person per year, and is subsumed within the mild-to-moderate decrement rather than counted separately, so as to avoid double counting. Direct treatment cost is borne by patients, payers or both and does not enter the productivity figure.
Transferability of non-Japanese parameters
Only three of the model inputs are Japanese in origin: gross domestic product, labour force and average salary from national statistical sources, and myopia and high myopia prevalence from the Nagahama Study.6 The two parameters that drive the result most strongly are not Japanese. The employment-reduction rate of 30.2% is a global average dominated by low-income and middle-income settings in which access to corrective services, disability support and workplace accommodation differs substantially from Japan; in a high-income setting with near-universal access to spectacles and an established disability employment framework, the true Japanese value is plausibly lower, which would reduce the severe component. The productivity decrement has no national origin at all, being a modelling assumption rather than a transferred estimate. Conversely, the direct cost component reflects Japanese price levels only through the blended spend figure, which is itself an approximation of the national modality mix rather than a surveyed quantity. The provenance of every parameter is marked explicitly in Table 1 so that readers can see which parts of the estimate rest on Japanese evidence and which do not. We regard this dependence on non-Japanese and non-empirical parameters as the principal threat to the validity of the estimate, and it is the reason we present the work as exploratory.
Probabilistic sensitivity analysis
To address uncertainty in several inputs simultaneously we conducted a Monte Carlo PSA of 10 000 iterations, following modelling good-practice guidance.9 Each uncertain parameter was assigned a probability distribution chosen to reflect its empirical anchoring and natural support: Beta distributions for proportions and bounded rates (mild-to-moderate decrement, severe visual impairment fraction, employment reduction, myopia prevalence); a Normal distribution for average salary, a tightly measured national statistic; a Gamma distribution for the right-skewed, strictly non-negative blended care spend; and a Triangular distribution for the caregiving multiplier, which has no empirical anchor. Distribution parameters were calibrated so that approximate 95% intervals matched the ranges in Table 1. Parameters were resampled independently in each iteration. Driver importance was assessed by Spearman rank correlation between each parameter and the total burden. Full distribution specifications and the simulation source code are provided in the Online Supplementary Document.
Comparison with published estimates
The base case was compared with two published references: the East Asia productivity-loss estimate of 1.27% of GDP3 and the Japanese all-cause visual impairment estimate of 1.7% of GDP,7 the latter an expected upper bound because myopia is one of several causes of visual impairment. Both references are themselves model-derived rather than direct empirical observations, so agreement with them supports plausibility but does not validate accuracy.
RESULTS
Deterministic base case
The deterministic base case was JPY 4.3 trillion (USD 28.5 billion) per year, equal to 0.64% of GDP. Lost productivity accounted for 80% of this total, consistent with the productivity-led structure reported for urban China.2 Component values are shown in Table 2.
Comparison with published estimates
The deterministic base case fell below both published references, as expected for a single-cause subset. The East Asia estimate implied JPY 8.5 trillion (USD 56.8 billion) and the all-cause visual impairment estimate implied JPY 11.4 trillion (USD 76.0 billion); the myopia-attributable base case was approximately 37% of the latter. A graphical comparison is provided in Figure S1 in the Online Supplementary Document.
Probabilistic sensitivity analysis
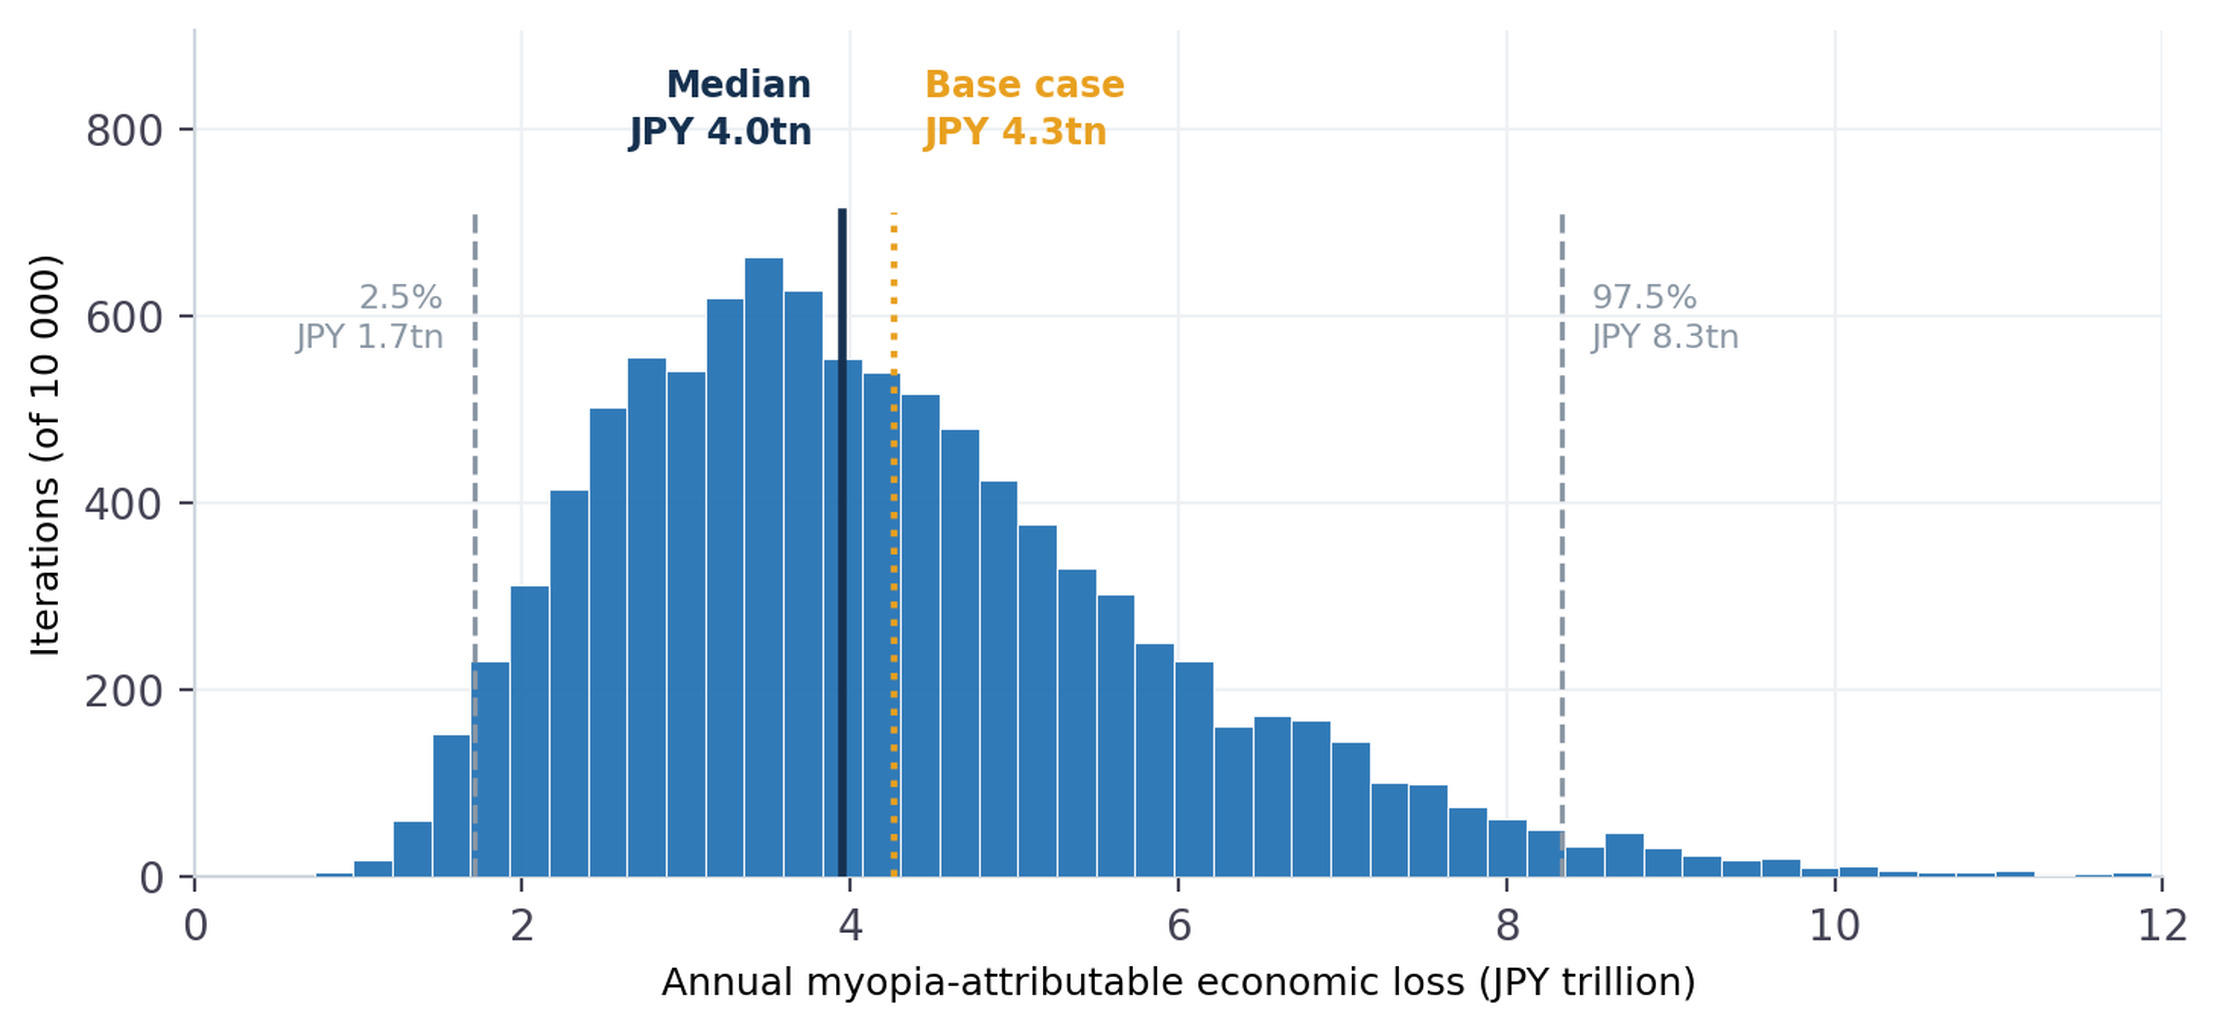
Monte Carlo simulation produced a modestly right-skewed distribution of the total annual burden, with a median of JPY 4.0 trillion (USD 26.4 billion) and a 95% credible interval (CrI) of JPY 1.7-8.3 trillion (USD 11.4-55.6 billion), a range of approximately fivefold (Figure 1). Lost productivity accounted for a mean of 77% of the total (95% CrI=51-92%). The deterministic base case of JPY 4.3 trillion lies between the median and the 75th percentile, reflecting the mild right skew of the distribution. The width of the credible interval indicates substantial, although not unbounded, joint parameter uncertainty.
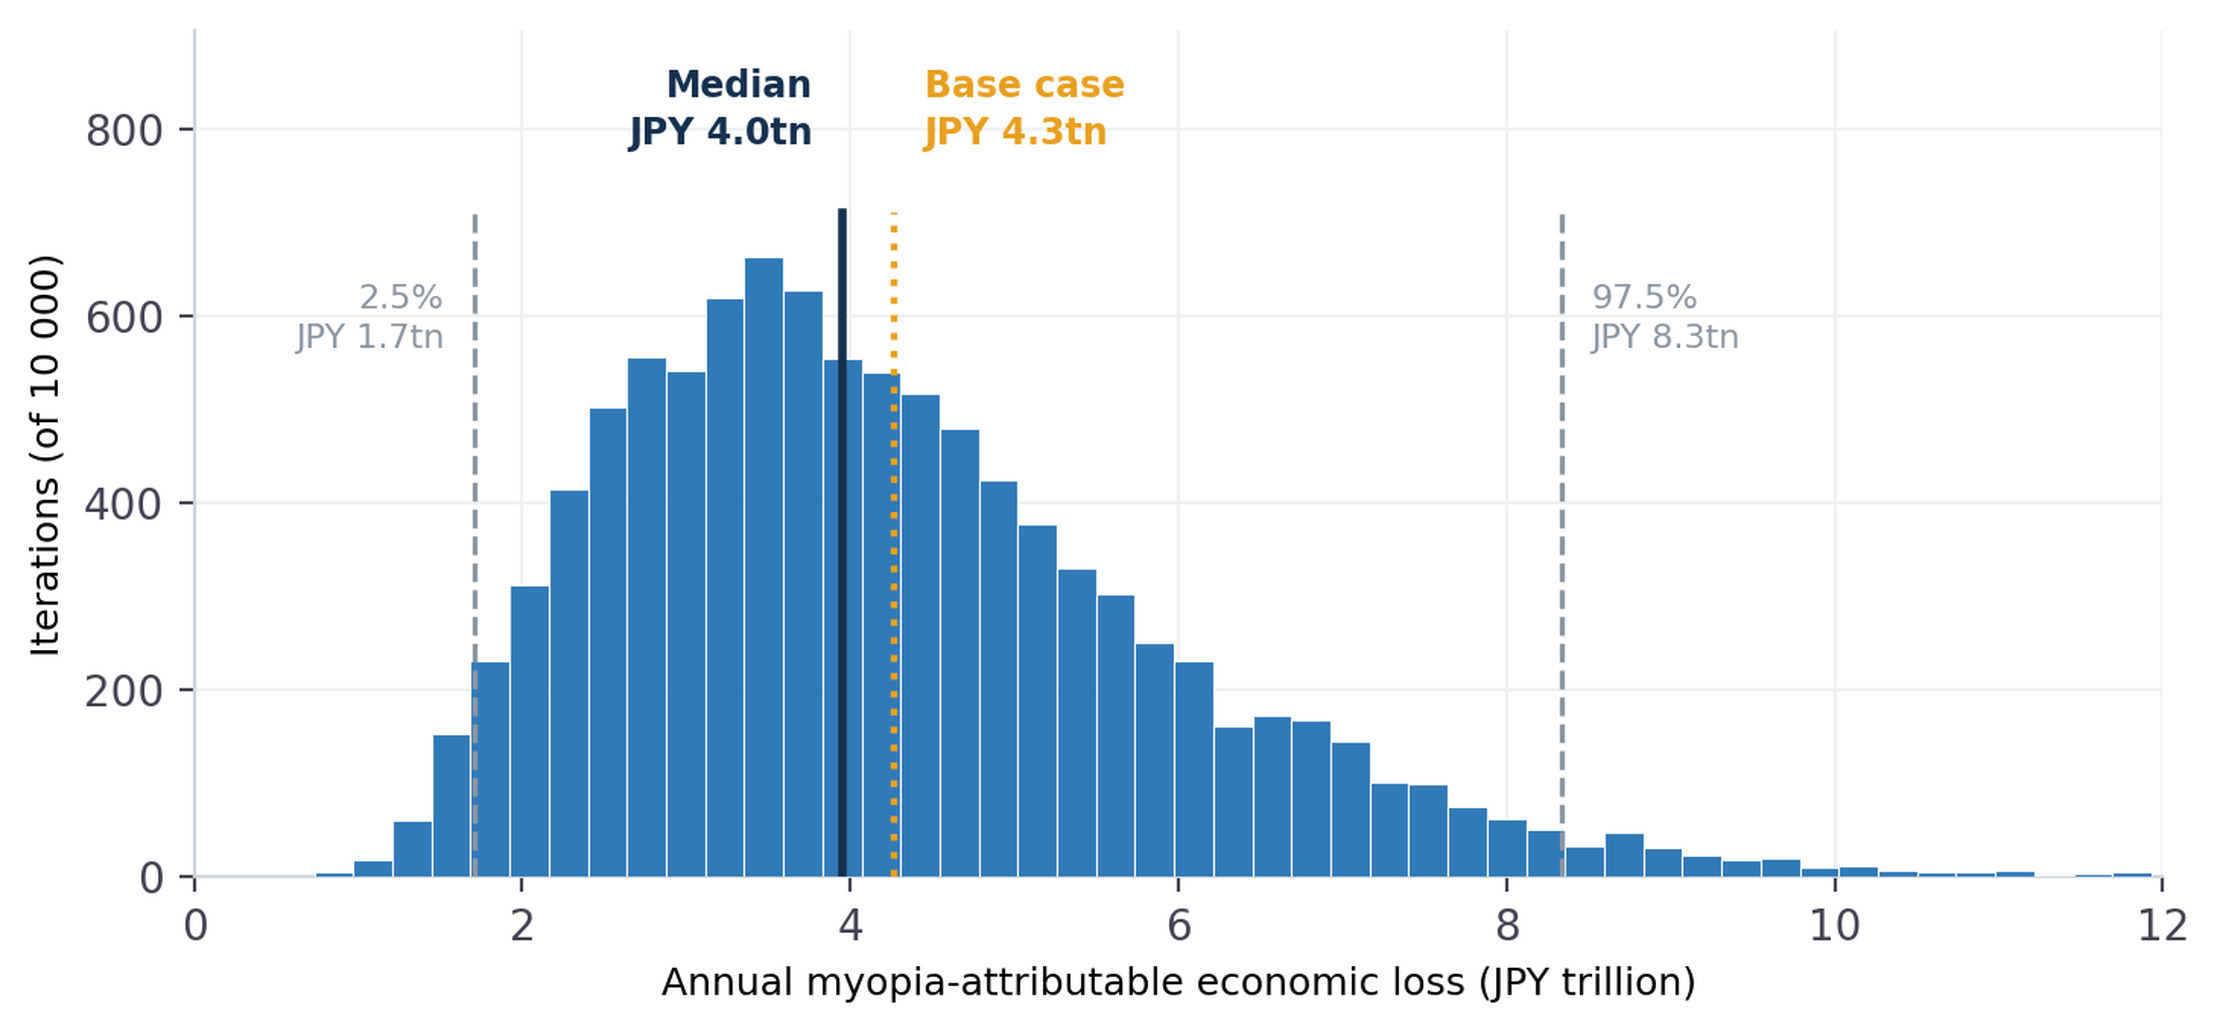
Because a fivefold credible interval remains wide for policy discussion, we also report two narrower summaries. The interquartile range of the probabilistic distribution was JPY 3.0-5.2 trillion (USD 19.9-34.6 billion). A scenario-based range, obtained by varying only the productivity decrement across its plausible bounds of 1% and 3% while holding all other parameters at their base values, gave JPY 2.6-5.9 trillion (USD 17.4-39.5 billion), with the 2% base case of JPY 4.3 trillion (USD 28.5 billion) at its centre. We suggest that this scenario-based range, rather than the full credible interval, is the more informative summary for policy purposes, provided it is understood as conditional on the other parameters being correct.
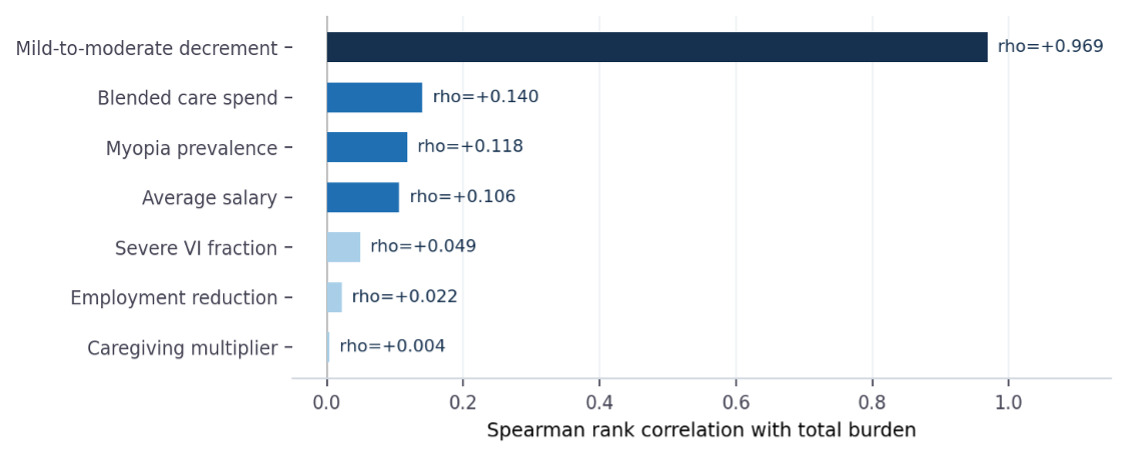
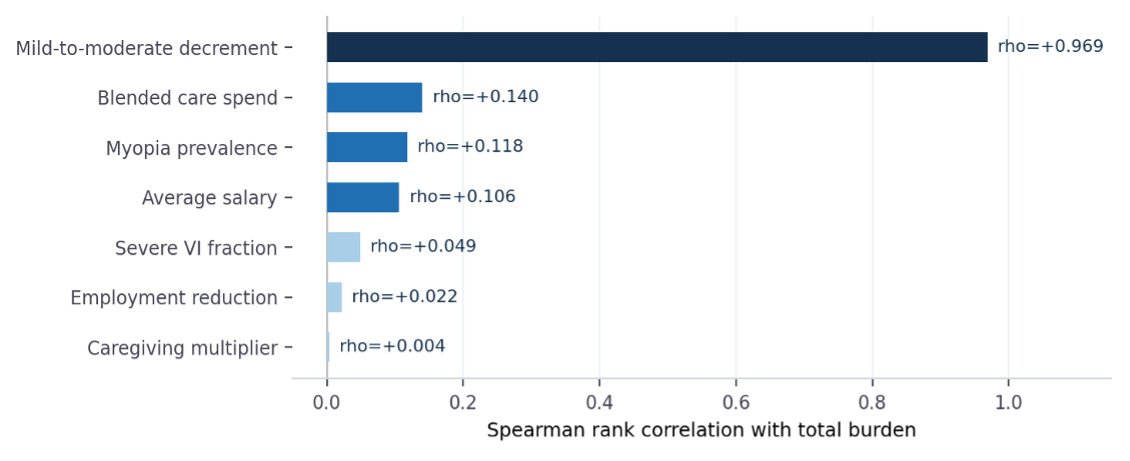
Driver analysis showed that the mild-to-moderate productivity decrement was overwhelmingly dominant (Spearman rho=0.97); all other parameters individually contributed absolute rho values below 0.15 (Figure 2). Varying this parameter alone across its plausible range moved the total between JPY 2.6 trillion (USD 17.4 billion) and JPY 5.9 trillion (USD 39.5 billion). This is itself a substantive finding: in the absence of Japanese empirical data on the productivity effect of corrected and under-corrected myopia in working populations, the estimate cannot be narrowed appreciably however well the other parameters are measured.
Projection to 2050
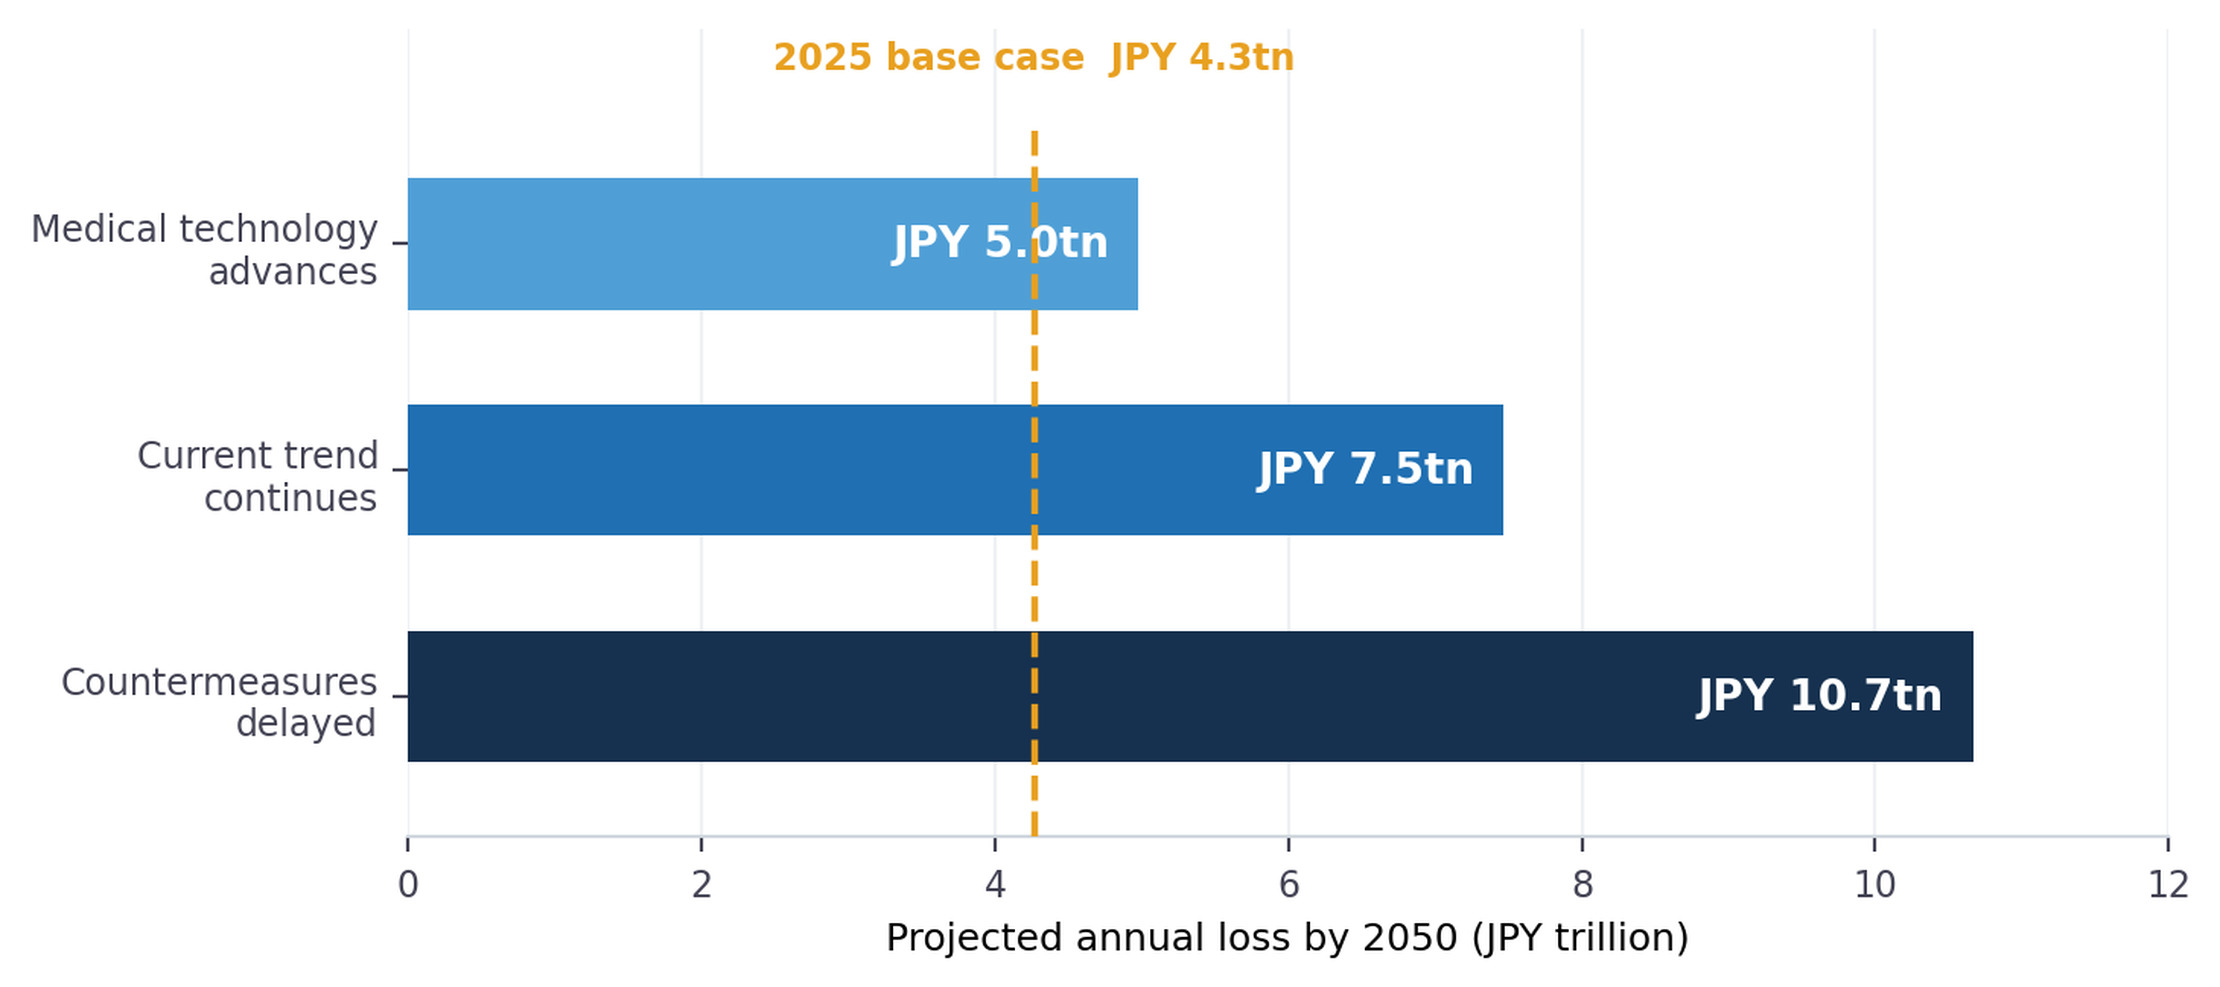
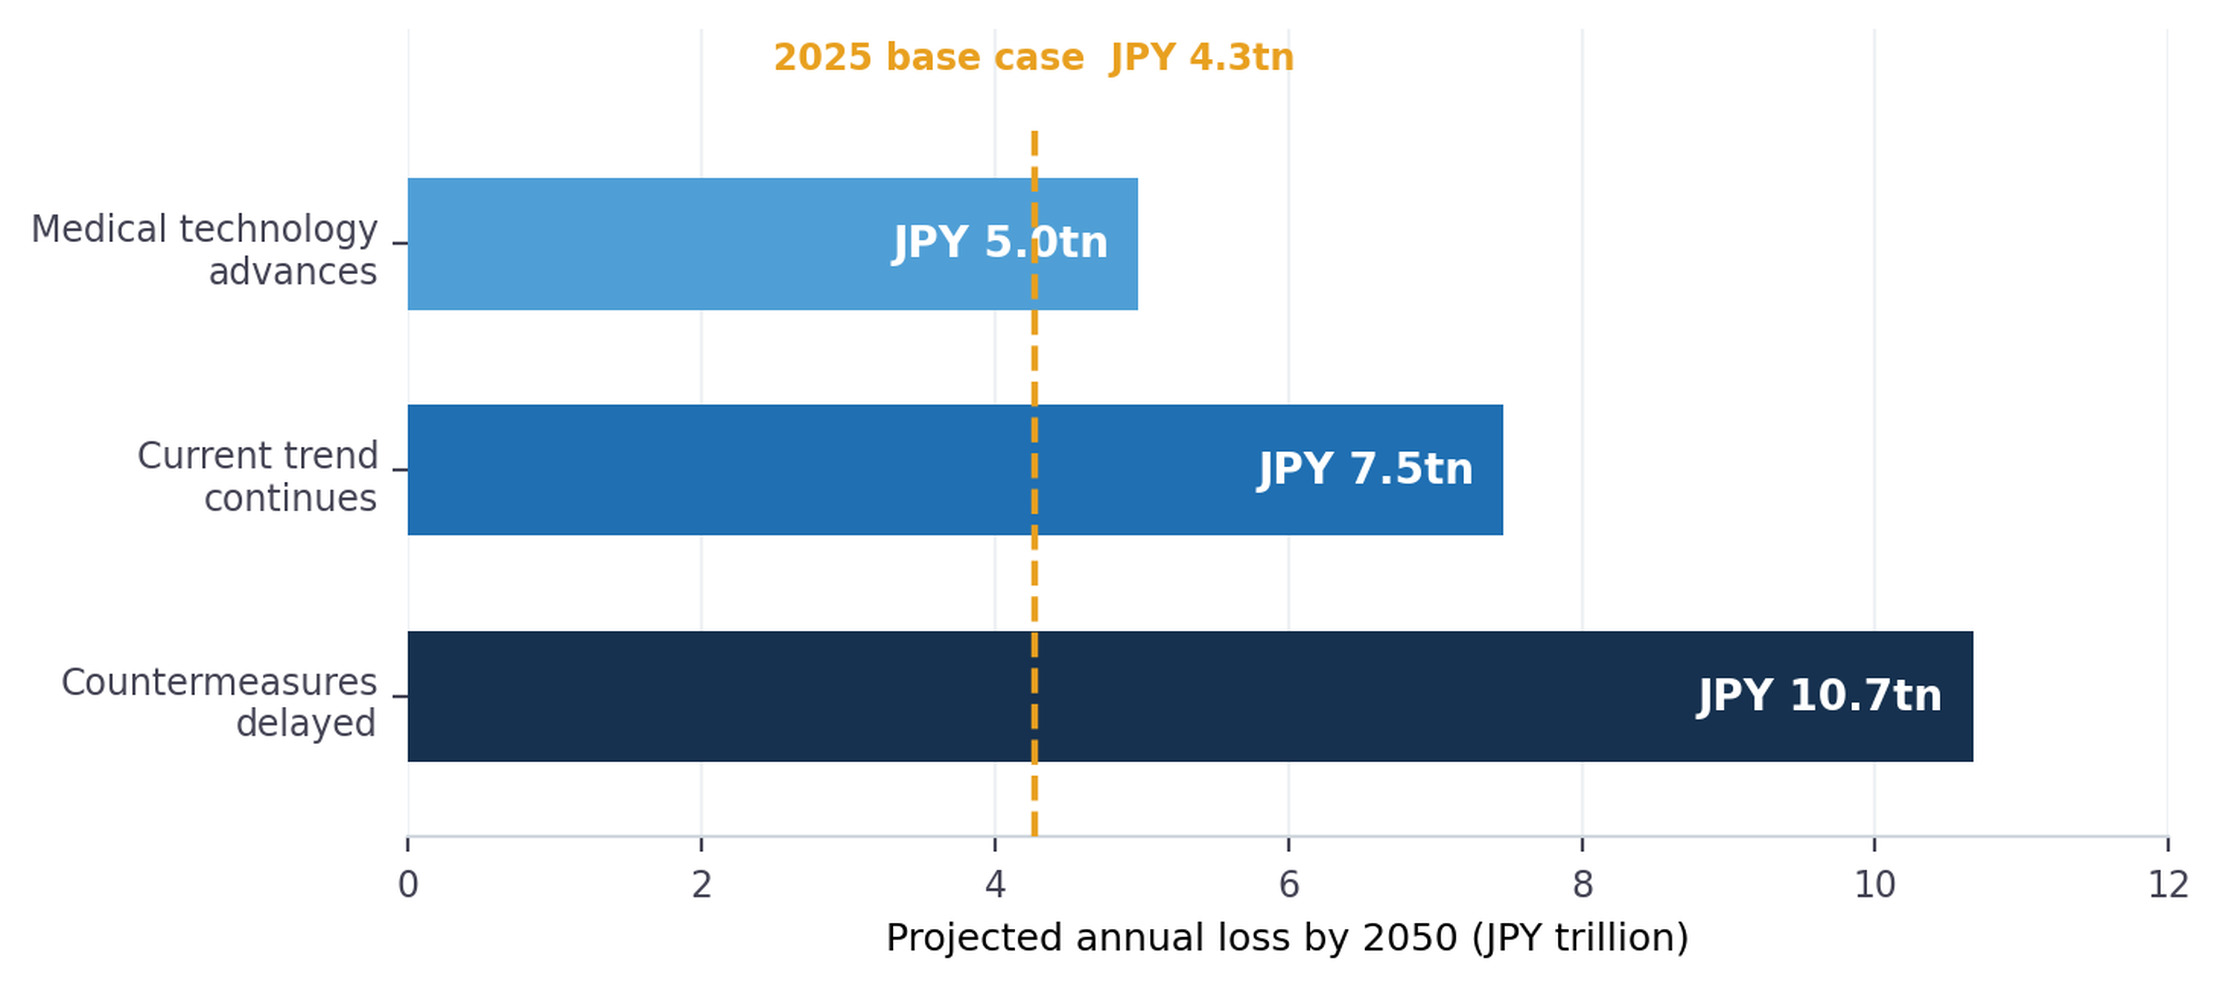
Anchored to Japanese demographic trends, namely a contracting working-age population and the ageing of myopic cohorts into age ranges with higher complication risk, scenario projection gave annual losses of JPY 5.0 trillion (USD 33.2 billion) under a technology-mitigated case, JPY 7.5 trillion (USD 49.8 billion) under continuation of current trends, and JPY 10.7 trillion (USD 71.1 billion) under a delayed-countermeasures case by 2050 (Figure 3). These 2050 figures are illustrative, not predictive. They are scenario arithmetic anchored to published trend statements rather than an epidemiological forecast, and they incorporate no cohort-specific incidence modelling, no treatment-uptake modelling and no formal demographic projection. They should be read as showing the direction and approximate scale of change implied by continuing trends, and should not be cited as forecasts of the burden in 2050.
DISCUSSION
This study provides a first, exploratory myopia-attributable economic estimate for Japan. Under plausible joint parameter ranges the median annual burden is approximately JPY 4.0 trillion (USD 26.4 billion), with a 95% CrI of JPY 1.7-8.3 trillion (USD 11.4-55.6 billion). The burden is structurally productivity-dominated, mirroring the pattern reported for urban China,2 and the deterministic base case is consistent with the East Asia estimate3 and sits appropriately below the published all-cause visual impairment estimate for Japan.7
The PSA showed that almost all of the model’s uncertainty traces to one parameter, the assumed mild-to-moderate productivity decrement. This is, in our view, the most important methodological finding of the study. It indicates that the burden is driven not by rare severe complications but by small, widespread effects on workplace productivity that are not currently measured in the Japanese population. Resolving this uncertainty requires dedicated Japanese research, ideally workplace-based studies of presenteeism, accommodative function and digital eye-strain symptoms among adequately and inadequately corrected people with myopia. Until such evidence exists the credible interval will remain wide however the other parameters are refined.
The model treats myopic workers as homogeneous. In reality, productivity effects will vary by myopia severity, correction modality and adequacy, occupation, age, educational attainment and access to eye care. Stratification would refine the estimate, but in the absence of Japanese productivity data the gains from stratification are limited by the same underlying data gap that drives the wide credible interval. Future incidence-based or lifetime models incorporating cohort-specific progression and treatment uptake would be better suited to addressing this heterogeneity, and would also permit equity-weighted and distributional analysis, which the present model does not attempt.
We are deliberately cautious about policy implications. This study estimates a burden; it does not evaluate the cost, effectiveness or cost-effectiveness of any preventive intervention. The suggestion that childhood prevention may be high-leverage rests on the irreversibility of axial elongation, on the documented association between high myopia and pathologic complications, and on the productivity-dominated structure of the estimated burden, but not on a formal economic evaluation. A cost-effectiveness analysis of childhood atropine, myopia-control contact lenses or behavioural interventions in the Japanese setting is the appropriate next step and is not undertaken here.
A previous newspaper commentary attributed to the author an annual myopia-attributable loss of approximately JPY 6 trillion (USD 40.0 billion) currently, rising to JPY 15 trillion (USD 100.0 billion) by 2050 in a worst case.10 Those earlier estimates addressed the same quantity as the present study, namely the economic loss attributable to myopia in Japan, and used the same broad component structure of productivity loss, care and social costs, and treatment costs. They were, however, directional figures prepared for general public discussion and were not peer reviewed. The difference between them and the present results is therefore not one of scope but of parameter choice, and it is almost entirely attributable to the assumed mild-to-moderate productivity decrement. Evaluating the present model at a decrement of 3%, the upper bound of the plausible range used here, gives a current burden of JPY 5.9 trillion (USD 39.5 billion) and, applying the same 2.5-fold demographic scaling used in the earlier commentary, JPY 14.8 trillion (USD 98.7 billion) by 2050. The earlier public figures thus correspond closely to the upper end of the scenario range reported in this paper, while the base case of JPY 4.3 trillion (USD 28.5 billion) corresponds to a decrement of 2% and the probabilistic median of JPY 4.0 trillion (USD 26.4 billion) is slightly lower again because the simulation also samples decrements below that value. We report the more conservative figures here because the probabilistic analysis shows that no value of this parameter can currently be justified from Japanese evidence, and a lower central estimate is the appropriate response to that uncertainty.
Limitations
No Japanese study of productivity loss from myopia exists; the mild-to-moderate decrement is a modelling assumption and the model’s single largest source of uncertainty (Spearman rho=0.97 with total burden). The prevalence-based framework does not model incidence, disease progression, lifetime costs or discounting of future flows, and no discount rate is applied; the 2050 scenario figures are therefore undiscounted and expressed at current price levels. The severe visual impairment fraction among people with high myopia, taken as 1.5%, is a modelling assumption; published pathologic myopia complication rates vary by definition and follow-up duration, and Japanese longitudinal data would be needed to refine it. The comparison estimates are themselves model-derived, so agreement supports plausibility but is not independent empirical validation. The Nagahama Study, although population-based and rigorous, covers a single region and ages 34-80 years, so its standardised prevalence may not represent the whole Japanese working-age population. The caregiving and direct-cost components are blended population averages, and no formal patient or public involvement informed the design. Productivity is valued using the human capital approach, which is likely to place the estimate at the upper end of what a friction cost method would yield. International parameters may not transfer fully to the Japanese context, and the two parameters that drive the result most strongly are not Japanese in origin. No pre-specified health economic analysis plan was registered, and the study was conducted by a single industry-affiliated author without independent co-authorship.
CONCLUSIONS
Under plausible parameter ranges the myopia-attributable economic burden in Japan appears non-trivial and productivity-dominated, but its magnitude cannot be quantified precisely without Japanese productivity research. The estimate is best interpreted as an exploratory modelling exercise intended to motivate empirical work and to inform policy discussion, rather than as a definitive national accounting. The single most important next step is workplace-based measurement of the productivity effects of myopia in the Japanese population.
Ethics statement
This study used only aggregate, publicly available data and did not involve human participants or identifiable individual data. Institutional review board approval and informed consent were therefore not required.
Data availability
All input parameters and their sources are listed in Table 1 and in the reference list. The Monte Carlo simulation source code and full distribution specifications are provided in the Online Supplementary Document, and no restricted data were used.
Funding
This research received no external funding. The article publication charge was funded by Kubota Pharmaceutical Holdings Co., Ltd.
Authorship contributions
RK is the sole author and meets all ICMJE authorship criteria. He conceived the study, designed and implemented the model and the probabilistic sensitivity analysis, analysed and interpreted the data, drafted and critically revised the manuscript, approved the final version, and is accountable for all aspects of the work.
Disclosure of interest
The author completed the ICMJE Disclosure of Interest Form (available upon request from the corresponding author) and declares the following activities and relationships: the author is Founder, Chairman and Chief Executive Officer of Kubota Pharmaceutical Holdings Co., Ltd., a company that develops treatments for eye disease, including myopia-related programmes, and that funded the article publication charge. This constitutes a potential competing interest that may align some implications of this work with commercial interests. To limit any effect on analytical independence, all parameters and their sources are listed publicly, the full simulation source code is provided so that every reported figure can be reproduced independently, the analysis makes no cost-effectiveness or pricing claim relating to any product, the headline result is presented as a probabilistic credible interval rather than a point estimate, and the manuscript states explicitly that its policy implications extend beyond its formal evidence base. In addition, and in response to editorial concern about sole authorship by an industry-affiliated investigator, the author commits to the following: no employee, officer or agent of Kubota Pharmaceutical Holdings Co., Ltd. other than the author contributed to the design, analysis, interpretation or drafting of this work, and the company had no role in the decision to submit; the complete simulation source code and parameter set are published with this article so that any reader may reproduce, audit or refute every reported figure without contacting the author; the author will supply, on request from the editors, the full analytic history of the model; and the author welcomes independent replication and would regard a published re-analysis reaching different conclusions as a legitimate and useful outcome. The author was unable to recruit an independent co-author within the timeframe of this submission and acknowledges that independent co-authorship would be a stronger safeguard than the measures listed here.
Use of artificial intelligence
The author used a generative artificial intelligence assistant (Anthropic Claude) in preparing this manuscript. The tool was used to assist with structuring the cost-of-illness model, writing the Monte Carlo simulation code, performing arithmetic and currency conversion, drafting and editing prose, and formatting tables and figures. All conceptual decisions, parameter choices, interpretations and conclusions are the author’s own. Following an earlier editorial observation, every reference in this manuscript has been individually verified by the author against the primary source or its indexed record, and errors introduced during AI-assisted drafting were corrected; in particular, the author list of reference 6 had been rendered incorrectly and has been corrected to the true authors. The author accepts full responsibility for the accuracy of the content, including all references and reported figures, in line with ICMJE guidance that artificial intelligence tools cannot be credited as authors. The author further notes, in response to an editorial observation about file metadata, that the submitted document was assembled programmatically from the underlying model output rather than typed and revised in a word processor, so its creation and modification timestamps reflect the moment of file generation and not the period over which the study was conceived, computed and revised. The analysis, its several revisions in response to review, and the verification of every reference were carried out over a substantially longer period, and the editors are welcome to request the intermediate model outputs and revision history.
Additional material
Online Supplementary Document. Figures 1 to 3 are additionally supplied as separate 300 dpi TIF files, as required by the journal, because image content is lost when manuscript text is transferred using the Copy Text Only option specified in the submission template.
Correspondence to:
Ryo Kubota, MD, PhD
Kubota Pharmaceutical Holdings Co., Ltd.
1-15-37 Minami-Aoyama, Minato-ku
Tokyo 107-0062, Japan
rkubota@kubotavision.com